Dealing with anything less than a dry runway can be a bit confusing, given the paucity of information in most manufacturer's flight manuals. It helps to know what the terms mean.
— James Albright
Updated:
2023-01-19
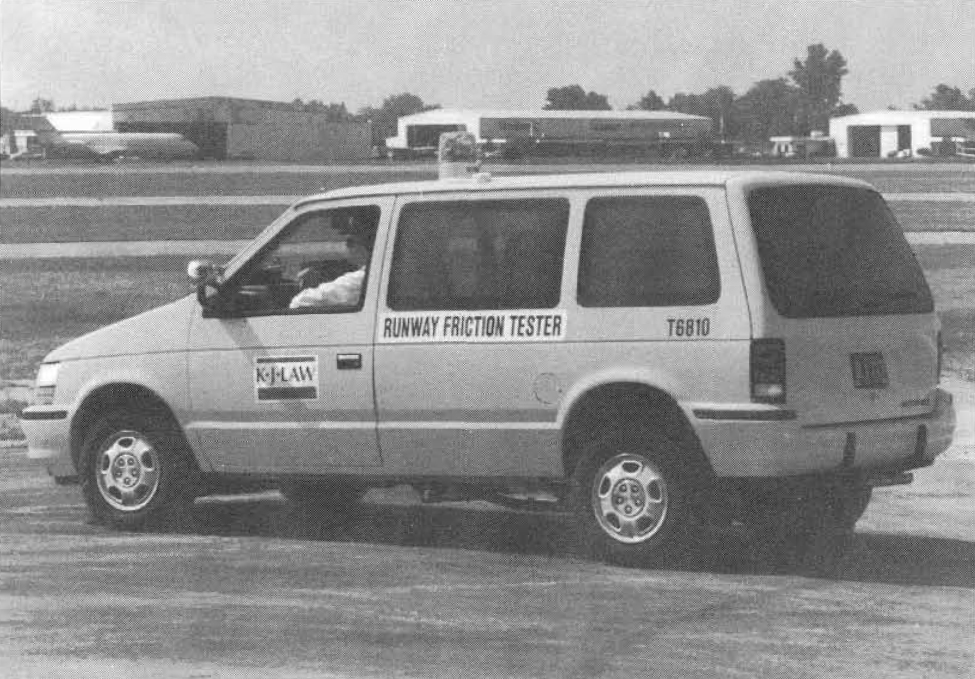
Runway friction tester,
from ICAO Doc 9137, Part 2, figure 5-6
What, after all, is the difference between "damp" and "wet." Once you've got that figured out, how do these measurements impact performance numbers? If you don't have good data on how to treat a slush covered runway, for example, the Canadian Runway Friction Index (CRFI) may help you. All that appears below but there is also other things to consider
1
Reporting
Water
There is a requirement to report the presence of water within the central half of the width of a runway and to make an assessment of water depth, where possible. To be able to report with some accuracy on the conditions of the runway, the following terms and associated descriptions should be used:
- Damp — the surface shows a change of colour due to moisture.
- Wet — the surface is soaked but there is no standing water.
- Water patches — significant patches of standing water are visible.
- Flooded — extensive standing water is visible
Source: ICAO Doc 9137, Part 2, ¶3.3
Additionally the condition may be called in terms of runway thirds: approach end, middle, and departure end. You often hear at Farnborough, "wet, wet, wet."
Snow or Ice
- Slush. Water-saturated snow which with a heel-and-toe slap-down motion against the ground will be displaced with a splatter; specific gravity: 0.5 up to 0.8.
- Snow (on the ground)
- Dry snow. Snow which can be blown if loose or, if compacted by hand, will fall apart again upon release; specific gravity: up to but not including 0.35.
- Wet snow. Snow which, if compacted by hand, will stick together and tend to or form a snowball; specific gravity: 0.35 up to but not including 0.5.
- Compacted snow. Snow which has been compressed into a solid mass that resists further compression and will hold together or break up into lumps if picked up; specific gravity: 0.5 and over.
Note.— Combinations of ice, snow and/or standing water may, especially when rain, rain and snow, or snow is falling, produce substances with specific gravities in excess of 0.8. These substances, due to their high water/ice content, will have a transparent rather than a cloudy appearance and, at the higher specific gravities, will be readily distinguishable from slush.
Source: ICAO Doc 9137, Part 2, ¶4.5
Mu
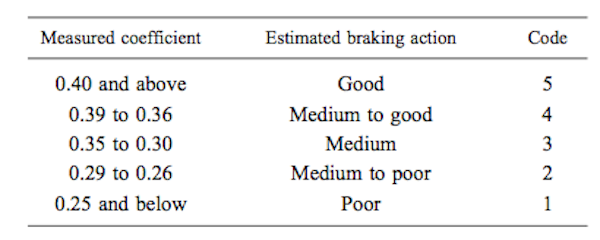
Friction coefficient for compacted snow and/or ice covered runways, from ICAO Doc 9137, Part 2, Table 4-1.
- There is also a requirement to report the friction characteristics of a compacted snow- and/or ice- covered runway. The friction conditions of a runway should be expressed as "braking action information" in terms of the measured/calculated friction coefficient μ or estimated braking action.
- Specific numerical μ values are necessarily related to the design and construction of the friction- measuring device, as well as to the surface condition being measured and, to a lesser extent, the measuring speed employed.
- Table 4-1 with associated descriptive terms was developed from friction data collected only in compacted snow and ice and should not therefore be taken to be absolute μ values applicable for all contaminant conditions. If the surface is affected by snow and/or ice and the braking action is reported as "good", pilots should expect to find conditions not as good as those for a dry, clean runway pavement surface (where the available friction may well be greater than that needed in any case). The value "good" is a comparative value and implies that aeroplanes should not experience directional control or braking difficulties when landing.
Source: ICAO Doc 9137, Part 2, ¶4.5
2
Hydroplaning
- Hydroplaning is a function of the water depth, tire pressure and speed. Moreover, the minimum speed at which a non- rotating tire will begin to hydroplane is lower than the speed at which a rotating tire will begin to hydroplane because a build up of water under the non-rotating tire increases the hydroplaning effect. Pilots should therefore be aware of this since it will result in a substantial difference between the take-off and landing roll aircraft performance under the same runway conditions. The minimum speed, in knots, at which hydroplaning will commence can be calculated by multiplying the square root of the tire pressure (PSI) by 7.7 for a non-rotating tire, or by 9 for a rotating tire.
- This equation gives an approximation of the minimum speed necessary to hydroplane on a smooth, wet surface with tires that are bald or have no tread. For example, the minimum hydroplaning speeds for an aircraft with tires inflated to 49 PSI are calculated as:
- When hydroplaning occurs, the aircraft's tires are completely separated from the actual runway surface by a thin water film and they will continue to hydroplane until a reduction in speed permits the tires to regain contact with the runway. This speed will be considerably lower than the speed at which hydroplaning commences. Under these conditions, the tire traction drops to almost negligible values, and in some cases, the wheel will stop rotating entirely. The tires will provide no braking capability and will not contribute to the directional control of the aircraft. The resultant increase in stopping distance is impossible to predict accurately, but it has been estimated to increase as much as 700 percent. Further, it is known that a 10-kt crosswind will drift an aircraft off the side of a 200-ft wide runway in approximately 7 sec under hydroplaning conditions.
Non-rotating tire:7.7 X √49 = 54 kt; or Rotating tire: 9 X √49 = 63 kt
Source: Transport Canada Aeronautical Information Manual, ¶1.6.6
A typical Gulfstream's main gear tire pressures will be around 190 psi. That means you can expect to begin hydroplaning around 125 knots and will not regain friction until 106 knots. The nose gear is typically about 135 psi, which means directional control via the nose wheel can be suspect around 105 knots.
3
Canadian Runway Friction Index (CRFI)
Description of Canadian Runway Friction Index (CRFI) and Method of Measurement. The decelerometer is an instrument mounted in a test vehicle that measures the decelerating forces acting on the vehicle when the brakes are applied. The instrument is graduated in increments from 0 to 1, the highest number being equivalent to the theoretical maximum decelerating capability of the vehicle on a dry surface. These numbers are referred to as the CRFI. It is evident that small numbers represent low braking coefficients of friction while numbers on the order of 0.8 and above indicate the braking coefficients to be expected on dry runways.
The brakes are applied on the test vehicle at 300-m (1 000-ft) intervals along the runway within a distance of 10 m (30 ft) from each side of the runway centreline at that distance from the centreline where the majority of aircraft operations take place at each given site. The readings taken are averaged and reported as the CRFI number.
Source: Transport Canada Aeronautical Information Manual, ¶1.6.3
Canada is one of the few countries that has stepped up to the plate and tried to quantify runway friction values and their impact on runway performance. This is important to many of us as many manufacturers provide CRFI data in lieu of test performance data.
- The information contained in Tables 1.3 and 1.4 has been compiled and is considered to be the best data available at this time because it is based upon extensive field test performance data of aircraft braking on winter-contaminated surfaces. The information should provide a useful guide to pilots when estimating aircraft performance under adverse runway conditions. The onus for the production of information, guidance or advice on the operation of aircraft on a wet and/or contaminated runway rests with the aircraft manufacturer. The information published in the TC AIM does not change, create any additional, authorize changes in, or permit deviations from regulatory requirements. These Tables are intended to be used at the pilot's discretion.
- Because of the many variables associated with computing accelerate-stop distances and balanced field lengths, it has not been possible to reduce the available data to the point where CRFI corrections can be provided, which would be applicable to all types of operations. Consequently, only corrections for landing distances and crosswinds are included pending further study of the take-off problem.
- It should be noted that in all cases the Tables are based on corrections to aircraft flight manual (AFM) dry runway data and that the certification criteria does not allow consideration of the extra decelerating forces provided by reverse thrust or propeller reversing. On dry runways, thrust reversers provide only a small portion of the total decelerating forces when compared to wheel braking. However, as wheel braking becomes less effective, the portion of the stopping distance attributable to thrust reversing becomes greater. For this reason, if reversing is employed when a low CRFI is reported, a comparison of the actual stopping distance with that shown in Table 1 will make the estimates appear overly conservative. Nevertheless, there are circumstances—such as crosswind conditions, engine out situations or reverser malfunctions—that may preclude their use.
- Landing distances recommended in Table 1 are intended to be used for aeroplanes with no discing and/or reverse thrust capability and are based on statistical variation measured during actual flight tests.
- Notwithstanding the above comments on the use of discing and/or reverse thrust, Table 1.4 may be used for aeroplanes with discing and/or reverse thrust capability and is based on the landing distances recommended in Table 1.3 with additional calculations that give credit for discing and/or reverse thrust. In calculating the distances in Table 1.4, the air distance from the screen height of 50 ft to touchdown and the delay distance from touchdown to the application of full braking remain unchanged from Table 1.3. The effects of discing and/or reverse thrust were used only to reduce the stopping distance from the application of full braking to a complete stop. The recommended landing distances stated in Table 1.4 take into account the reduction in landing distances obtained with the use of discing and/or reverse thrust capability for a turboprop-powered aeroplane and with the use of reverse thrust for a turbojet-powered aeroplane. Representative low values of discing and/or reverse thrust effect have been assumed and, therefore, the data may be conservative for properly executed landings by some aeroplanes with highly effective discing and/or thrust reversing systems.
- The crosswind limits for CRFI shown in Figure 1.1 contain a slightly different display range of runway friction index values from those listed in Tables 1.3 and 1.4. However, the CRFI values used for Figure 1.1 are exactly the same as those used for Tables 1.3 and 1.4 and are appropriate for the index value increments indicated.
Source: Transport Canada Aeronautical Information Manual, ¶1.6.7.
CRFI Recommended Landing Distances (No discing/reverse thrust)
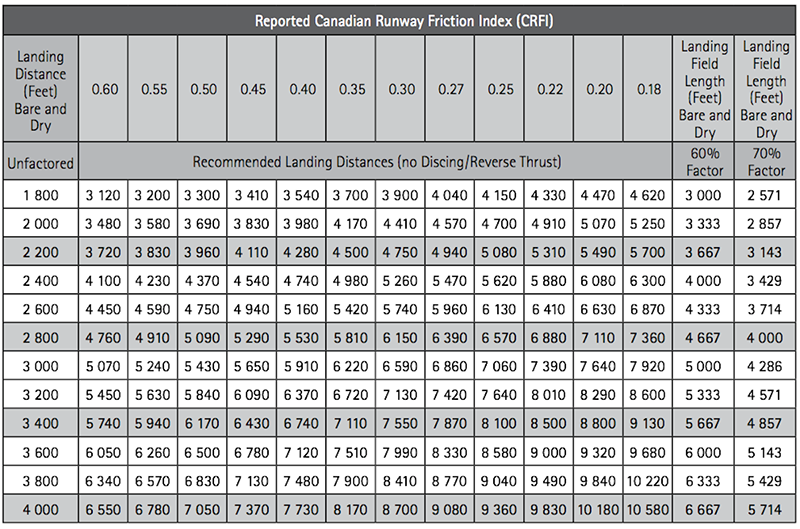
- The recommended landing distances in Table 1.3 are based on a 95 percent level of confidence. A 95 percent level of confidence means that in more than 19 landings out of 20, the stated distance in Table 1 will be conservative for properly executed landings with all systems serviceable on runway surfaces with the reported CRFI.
- Table 1.3 will also be conservative for turbojet- and turboprop- powered aeroplanes with reverse thrust, and additionally, in the case of turboprop-powered aeroplanes, with the effect obtained from discing.
- The recommended landing distances in CRFI Table 1.3 are based on standard pilot techniques for the minimum distance landings from 50 ft, including a stabilized approach at VRef using a glide slope of 3° to 50 ft or lower, a firm touchdown, minimum delay to nose lowering, minimum delay time to deployment of ground lift dump devices and application of brakes, and sustained maximum antiskid braking until stopped.
- Landing field length is the landing distance divided by 0.6 (turbojets) or 0.7 (turboprops). If the aircraft flight manual (AFM) expresses landing performance in terms of landing distance, enter the Table from the left-hand column. However, if the AFM expresses landing performance in terms of landing field length, enter the Table from one of the right-hand columns, after first verifying which factor has been used in the AFM.
Source: Transport Canada Aeronautical Information Manual, ¶1.6.7.
CRFI Recommended Landing Distances (Discing/reverse thrust)
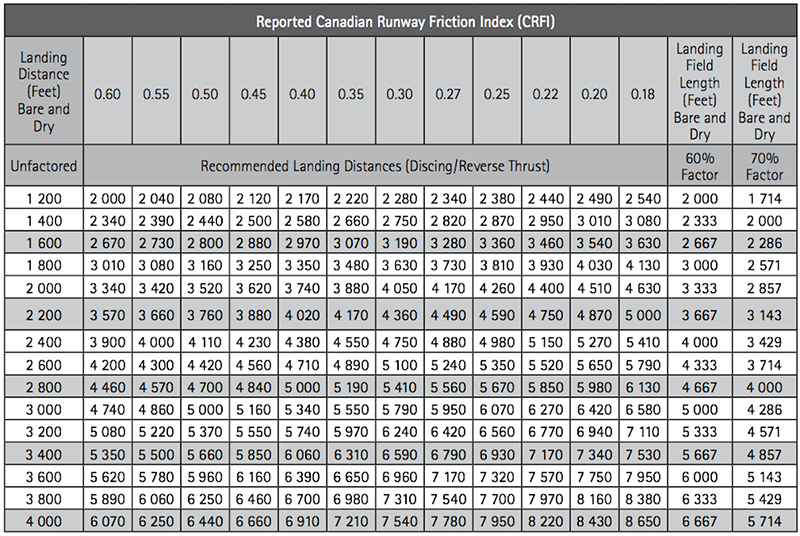
- The recommended landing distances in Table 1.4 are based on a 95 percent level of confidence. A 95 percent level of confidence means that in more than 19 landings out of 20, the stated distance in Table 1.4 will be conservative for properly executed landings with all systems serviceable on runway surfaces with the reported CRFI.
- The recommended landing distances in Table 1.4 take into account the reduction in landing distances obtained with the use of discing and/or reverse thrust capability for a turboprop-powered aeroplane and with the use of reverse thrust for a turbojet-powered aeroplane. Table 1.4 is based on the landing distances recommended in Table 1 with additional calculations that give credit for discing and/or reverse thrust. Representative low values of discing and/or reverse thrust effect have been assumed, hence the 4. data will be conservative for properly executed landings by some aeroplanes with highly effective discing and/or thrust reversing systems.
- The recommended landing distances in CRFI Table 1.4 are based on standard pilot techniques for the minimum distance landings from 50 ft, including a stabilized approach at VRef using a glide slope of 3° to 50 ft or lower, a firm touchdown, minimum delay to nose lowering, minimum delay time to deployment of ground lift dump devices and application of brakes and discing and/or reverse thrust, and sustained maximum antiskid braking until stopped. In Table 2, the air distance from the screen height of 50 ft to touchdown and the delay distance from touchdown to the application of full braking remain unchanged from Table 1. The effects of discing/reverse thrust were used only to reduce the stopping distance from the application of full braking to a complete stop.
- Landing field length is the landing distance divided by 0.6 (turbojets) or 0.7 (turboprops). If the AFM expresses landing performance in terms of landing distance, enter the Table from the left-hand column. However, if the AFM expresses landing performance in terms of landing field length, enter the Table from one of the right-hand columns, after first verifying which factor has been used in the AFM.
Source: Transport Canada Aeronautical Information Manual, ¶1.6.7.
CRFI Crosswind Limits
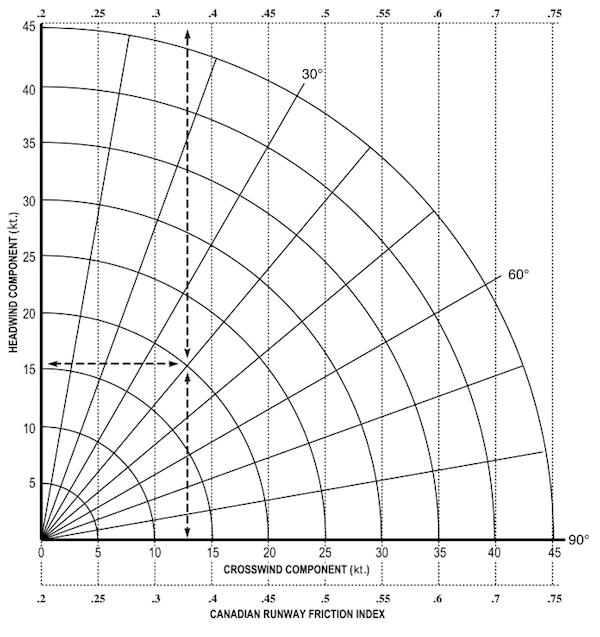
Crosswind Limits for CRFI, from Transport Canada Aeronautical Information Manual, ¶1.6.7., Figure 1.1.
This chart provides information for calculating headwind and crosswind components. The vertical lines indicate the recommended maximum crosswind component for reported CRFI.
Source: Transport Canada Aeronautical Information Manual, ¶1.6.7.
Expected CRFI Range
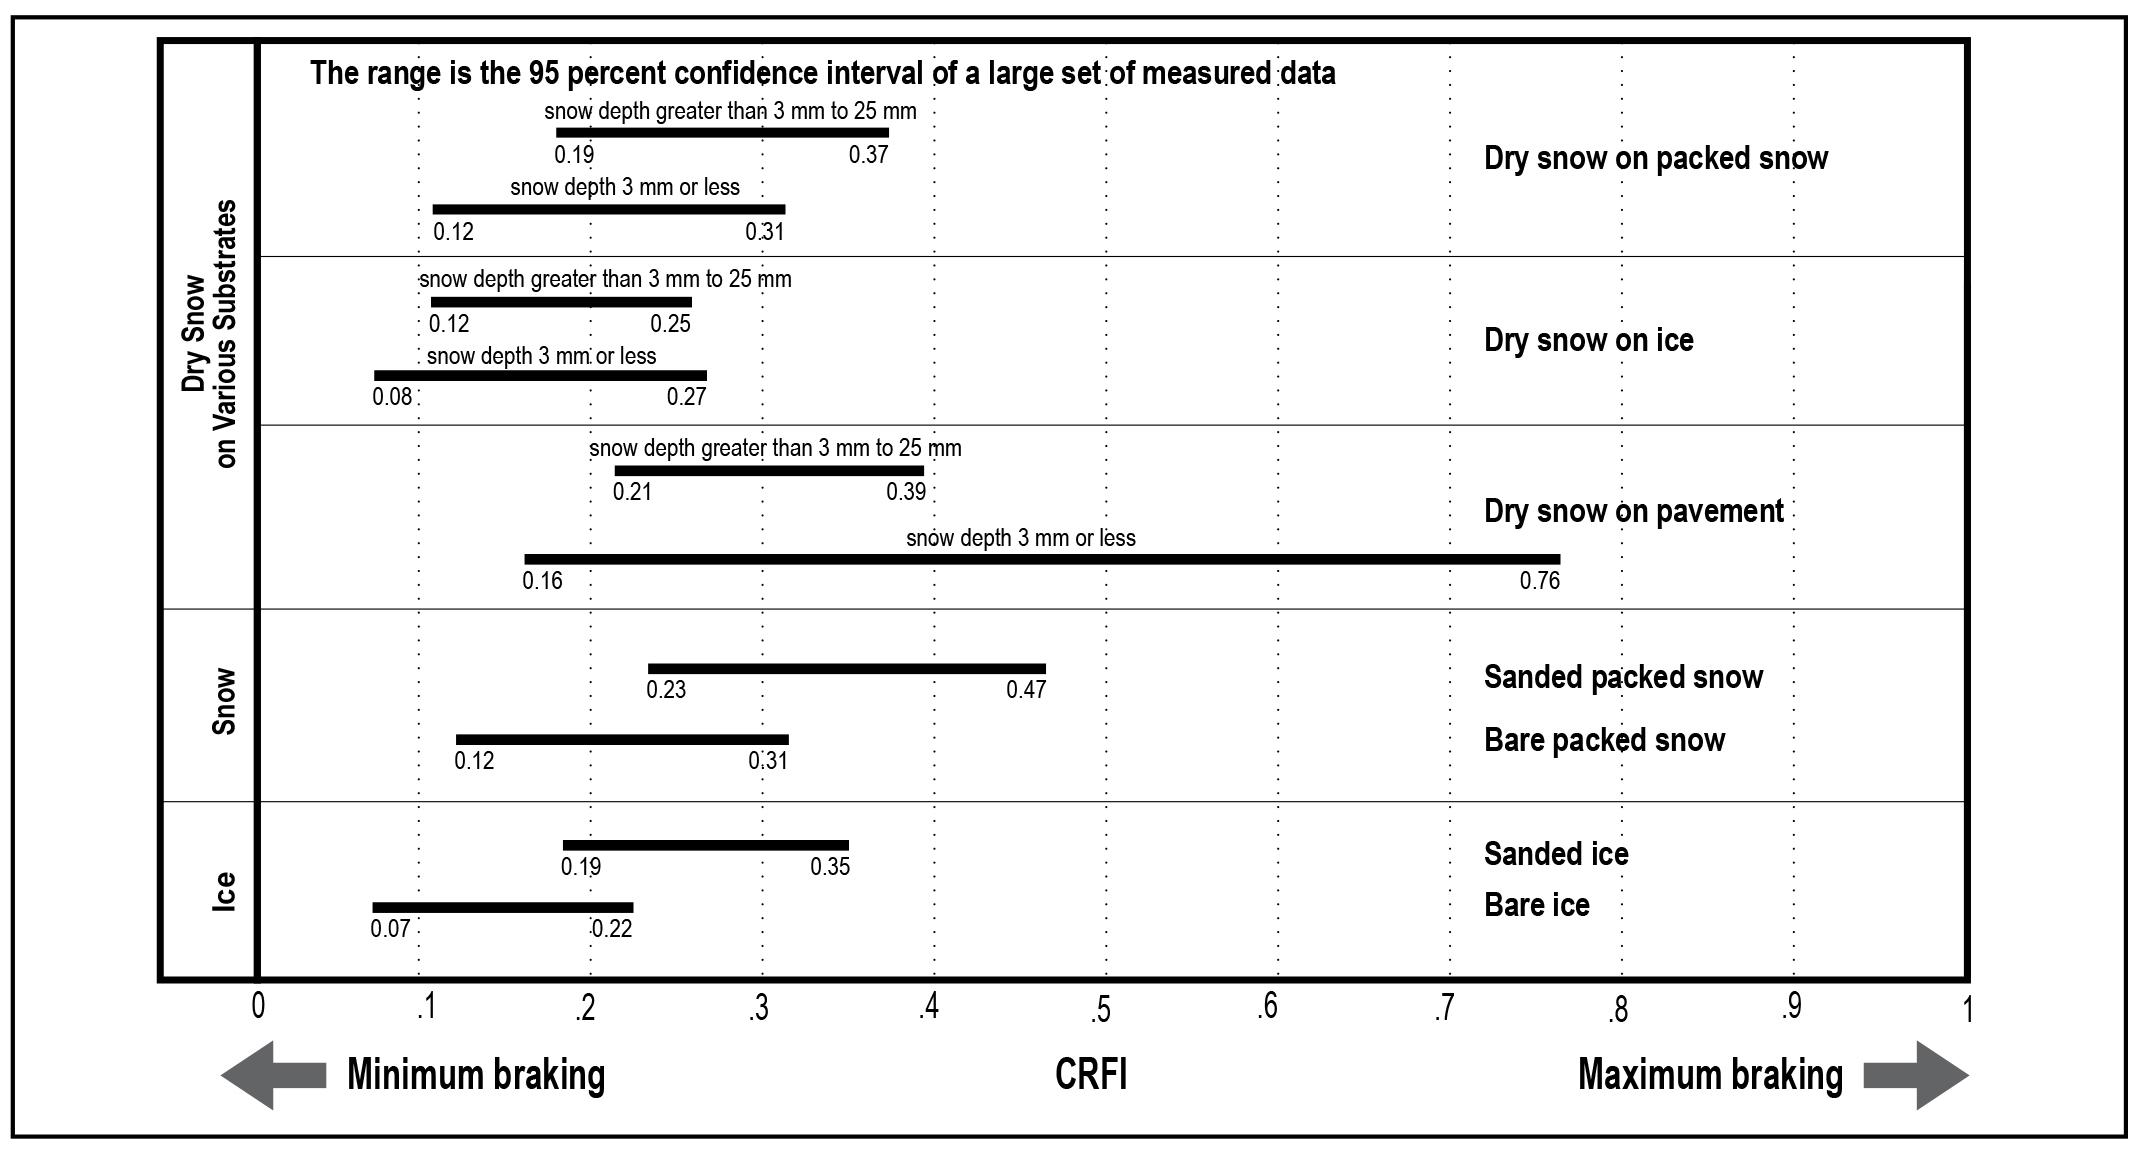
Expected CRFI Range, from Transport Canada Aeronautical Information Manual, ¶1.6.6., Table 1.5(a).
- The CRFI depends on the surface type, as shown in Table 1.5(a). It should be noted that:
- the CRFI values given in Table 1.5(a) are applicable to all temperatures. Extensive measurements have shown that there is no correlation between the CRFI and the surface temperature. The case where the surface temperature is just at the melting point (i.e. about 0°C) may be an exception, as a water film may form from surface melting, which could induce slippery conditions with CRFIs less than those in Table 4a.
- the CRFI may span a range of values for various reasons, such as variations in texture among surfaces within a given surface class. The expected maximum and minimum CRFIs for various surfaces are listed in Table 4b. Note that these values are based on a combination of analyses of extensive measurements and sound engineering judgment.
- the largest range in CRFI is to be expected for a thin layer (3 mm or less in thickness) of dry snow on pavement (Table 4a). This variation may occur due to:
- non-uniform snow coverage; and/or
- the tires breaking through the thin layer.
In either case, the surface presented to the aircraft may range from snow to pavement.
Source: Transport Canada Aeronautical Information Manual, ¶1.6.7.
References
(Source material)
ICAO Doc 9137 - Airport Services Manual - Part 2 - Pavement Surface Conditions, International Civil Aviation Organization, Fourth Edition, 2002
Transport Canada Aeronautical Information Manual, 2023-02