I used to proudly proclaim the reliability of my previous aircraft exactly as given in the Gulfstream sales brochures: “the G450’s dispatch reliability rate is 99.7 percent.” I wrote up our second missed trip in that jet on our 600th flight log, back in the days we used paper for these things. If you do the math, 2 out of 600 comes to 0.3 percent. More to the point, we made 598 trips out of 600 attempts, matching the 99.7 percent claim. But when my current aircraft, a Gulfstream GVII, had temporary fleetwide restrictions placed on it for anti-icing and later for the impact of winds on the fly-by-wire system, none of those missed trips counted against the aircraft’s record. They were weather problems, you see, not aircraft problems. This isn’t a Gulfstream issue; the entire industry plays these statistical shenanigans. It is more a problem with how we perceive reliability. And this problem impacts the way we aviators accept risk. If you judge your actions based on probabilities measured by decimal points beyond 99, you might be accepting more risk than you should.
— James Albright

Updated:
2023-01-01
(Photo: Sashkin at Shutterstock)
When I started flying jets in 1979, reliability statistics were almost entirely a matter of the aircraft’s mechanical fitness to fly. If the parts worked, you flew. My first jet was the Cessna T-37 “Tweet,” which I flew as a student and later as a qualified Air Force pilot. The Tweet was almost entirely mechanical. The only electronics involved were for the radios, lights, and a few other basics. The flight controls were nothing but a control stick and mechanical linkages like cables, pulleys, and hinges. What could possibly go wrong? A fellow student that year found out. He found himself on a solo flight with a control stick stuck full right while practicing an aileron roll. This pilot had two things working in his favor: 15,000 feet of altitude and a quick mind. He realized that something must have wedged itself somewhere between the stick and an aileron, so he pushed the nose over for as much negative-G as he could tolerate. That freed a ballpoint pen wedged into the stick pivot hinge through a hole in the leather boot designed to prevent this kind of interference.
With many mechanical failures, like the hole in the stick boot, the path from unreliable to trustworthy is easily mapped. You can predict material failure, you can improve inspection protocols, you can come up with a better mousetrap. In the old days, when presented with aircraft wreckage, investigators could invariably find the “Golden BB,” the cause of it all. Aircraft reliability was easily understood by pilots and mechanics. Aircraft became more reliable as the aviation industry became smarter. But these days our aircraft are so much more than cables and pulleys and predicting failures has become the realm of experts.
2 — Why reliability math doesn’t work

1
Experts aren't
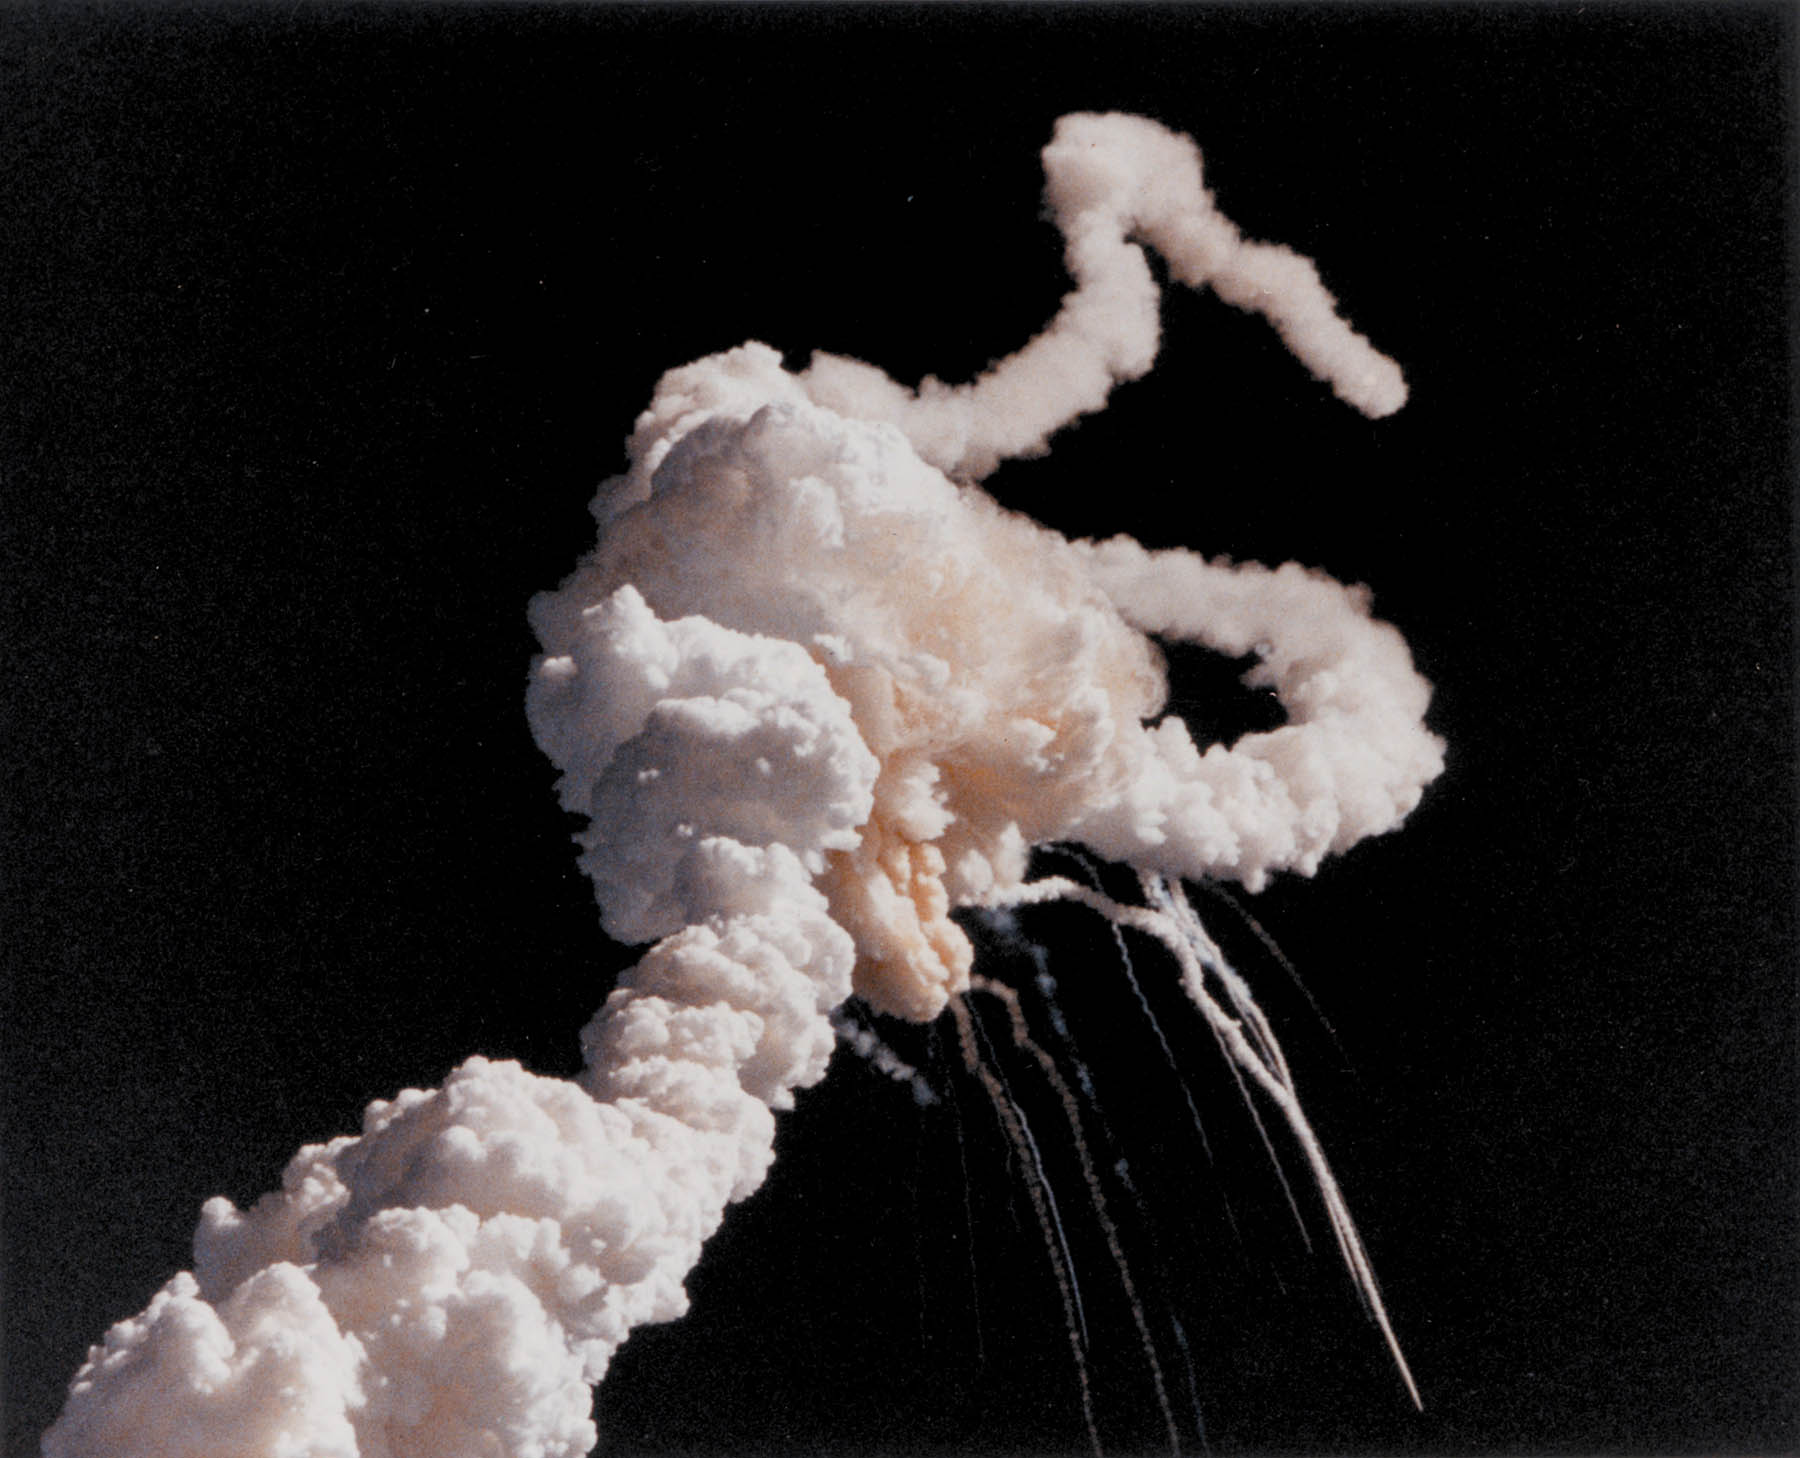
Space Shuttle Challenger, January 28, 1986
Aircraft have become so complicated that it is only natural that we as operators must assume much of what we read in our manuals must be true because it came from “the experts.” Consider, for example, the safety record of the space shuttle. We were told early on by National Aeronautics and Space Administration (NASA) experts that the chances of an accident was 1 in 100,000, pretty good odds. After the loss of Challenger in 1986, we found out that the line engineers in the solid rocket booster program thought the rate would be 1 in 100, but by the time these numbers were filtered through NASA management, the risk was considerably diluted. The actual rate? Of 135 launches, there were 2 losses.
More about the NASA culture leading to the loss of the Space Shuttle Challenger: The Normalization of Deviance.
2
Why reliability math doesn’t work
How do you discern between fantasy, such as the 1 in 100,000 prediction, and reality? As with many things in life, it starts with math. To get a grasp on how complicated this can be, consider a very simple transportation device, a bicycle. You could break down the components into just three things: two wheels, two pedals, and the handlebars. If any of these three components break, you are theoretically done. From a reliability point of view, this is a series system where everything has to work for the entire system to work.
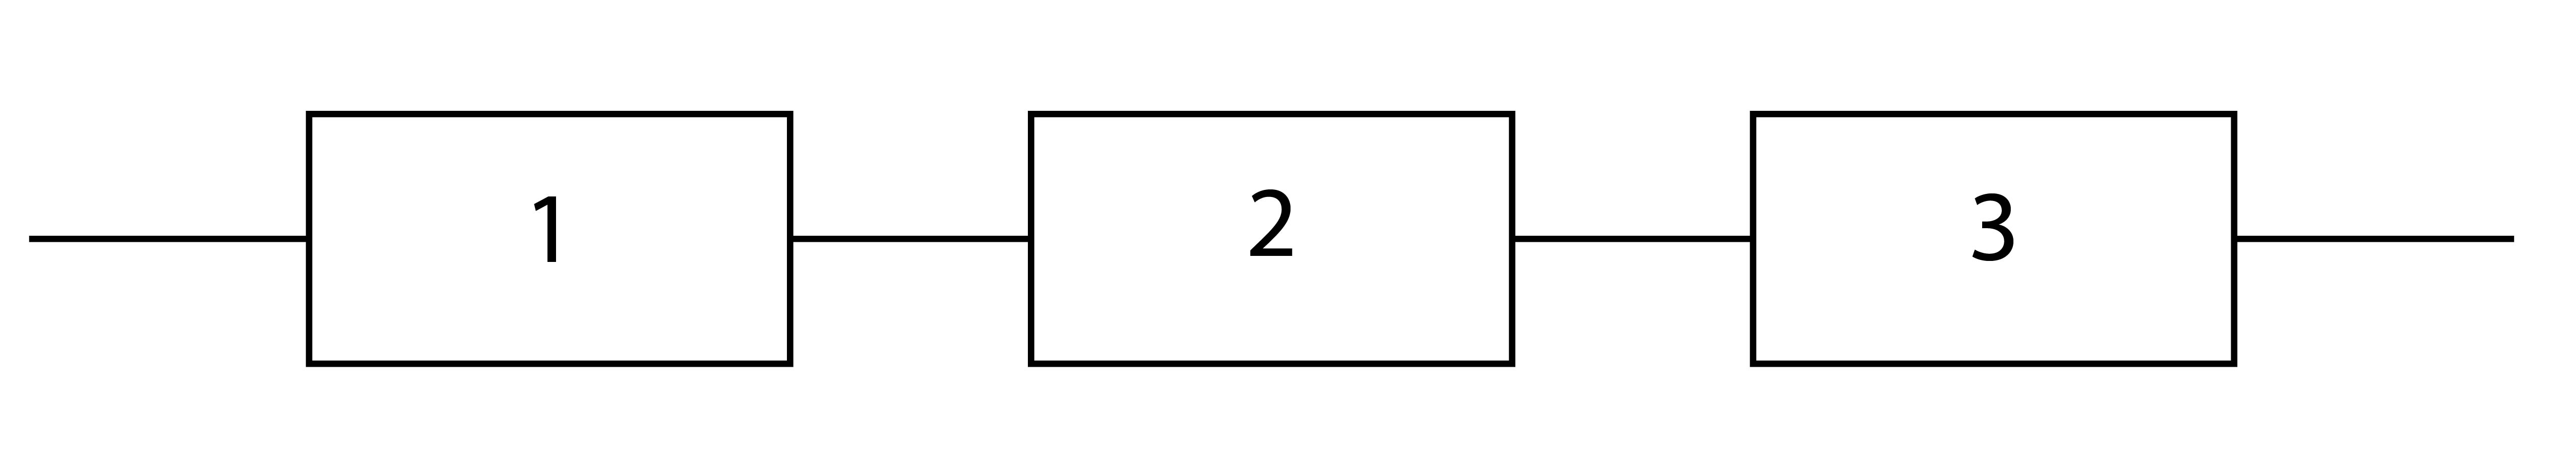
Series components
Of course, there are more components than just these three. You could add the sprockets and chain between the pedals and wheels, for example. But let’s keep it simple for now. You compute the overall reliability by multiplying the individual reliability of each component, which we’ll rate from zero (completely unreliable) to one (completely reliable). So Rbicycle = Rwheels x Rpedals x Rhandlebars. If the wheels are rated at 0.7 (they are known to go flat now and then), the pedals at 0.99 (they rarely fail), and the handlebars at 0.9 (they are also very reliable, we can predict the bicycle will be reliable at a rate of 0.7 x 0.99 x 0.9 = 0.624, or about 63 percent. But does a flat tire render the bicycle completely unusable? We have systems within the system, and some of these are better classified as parallel.
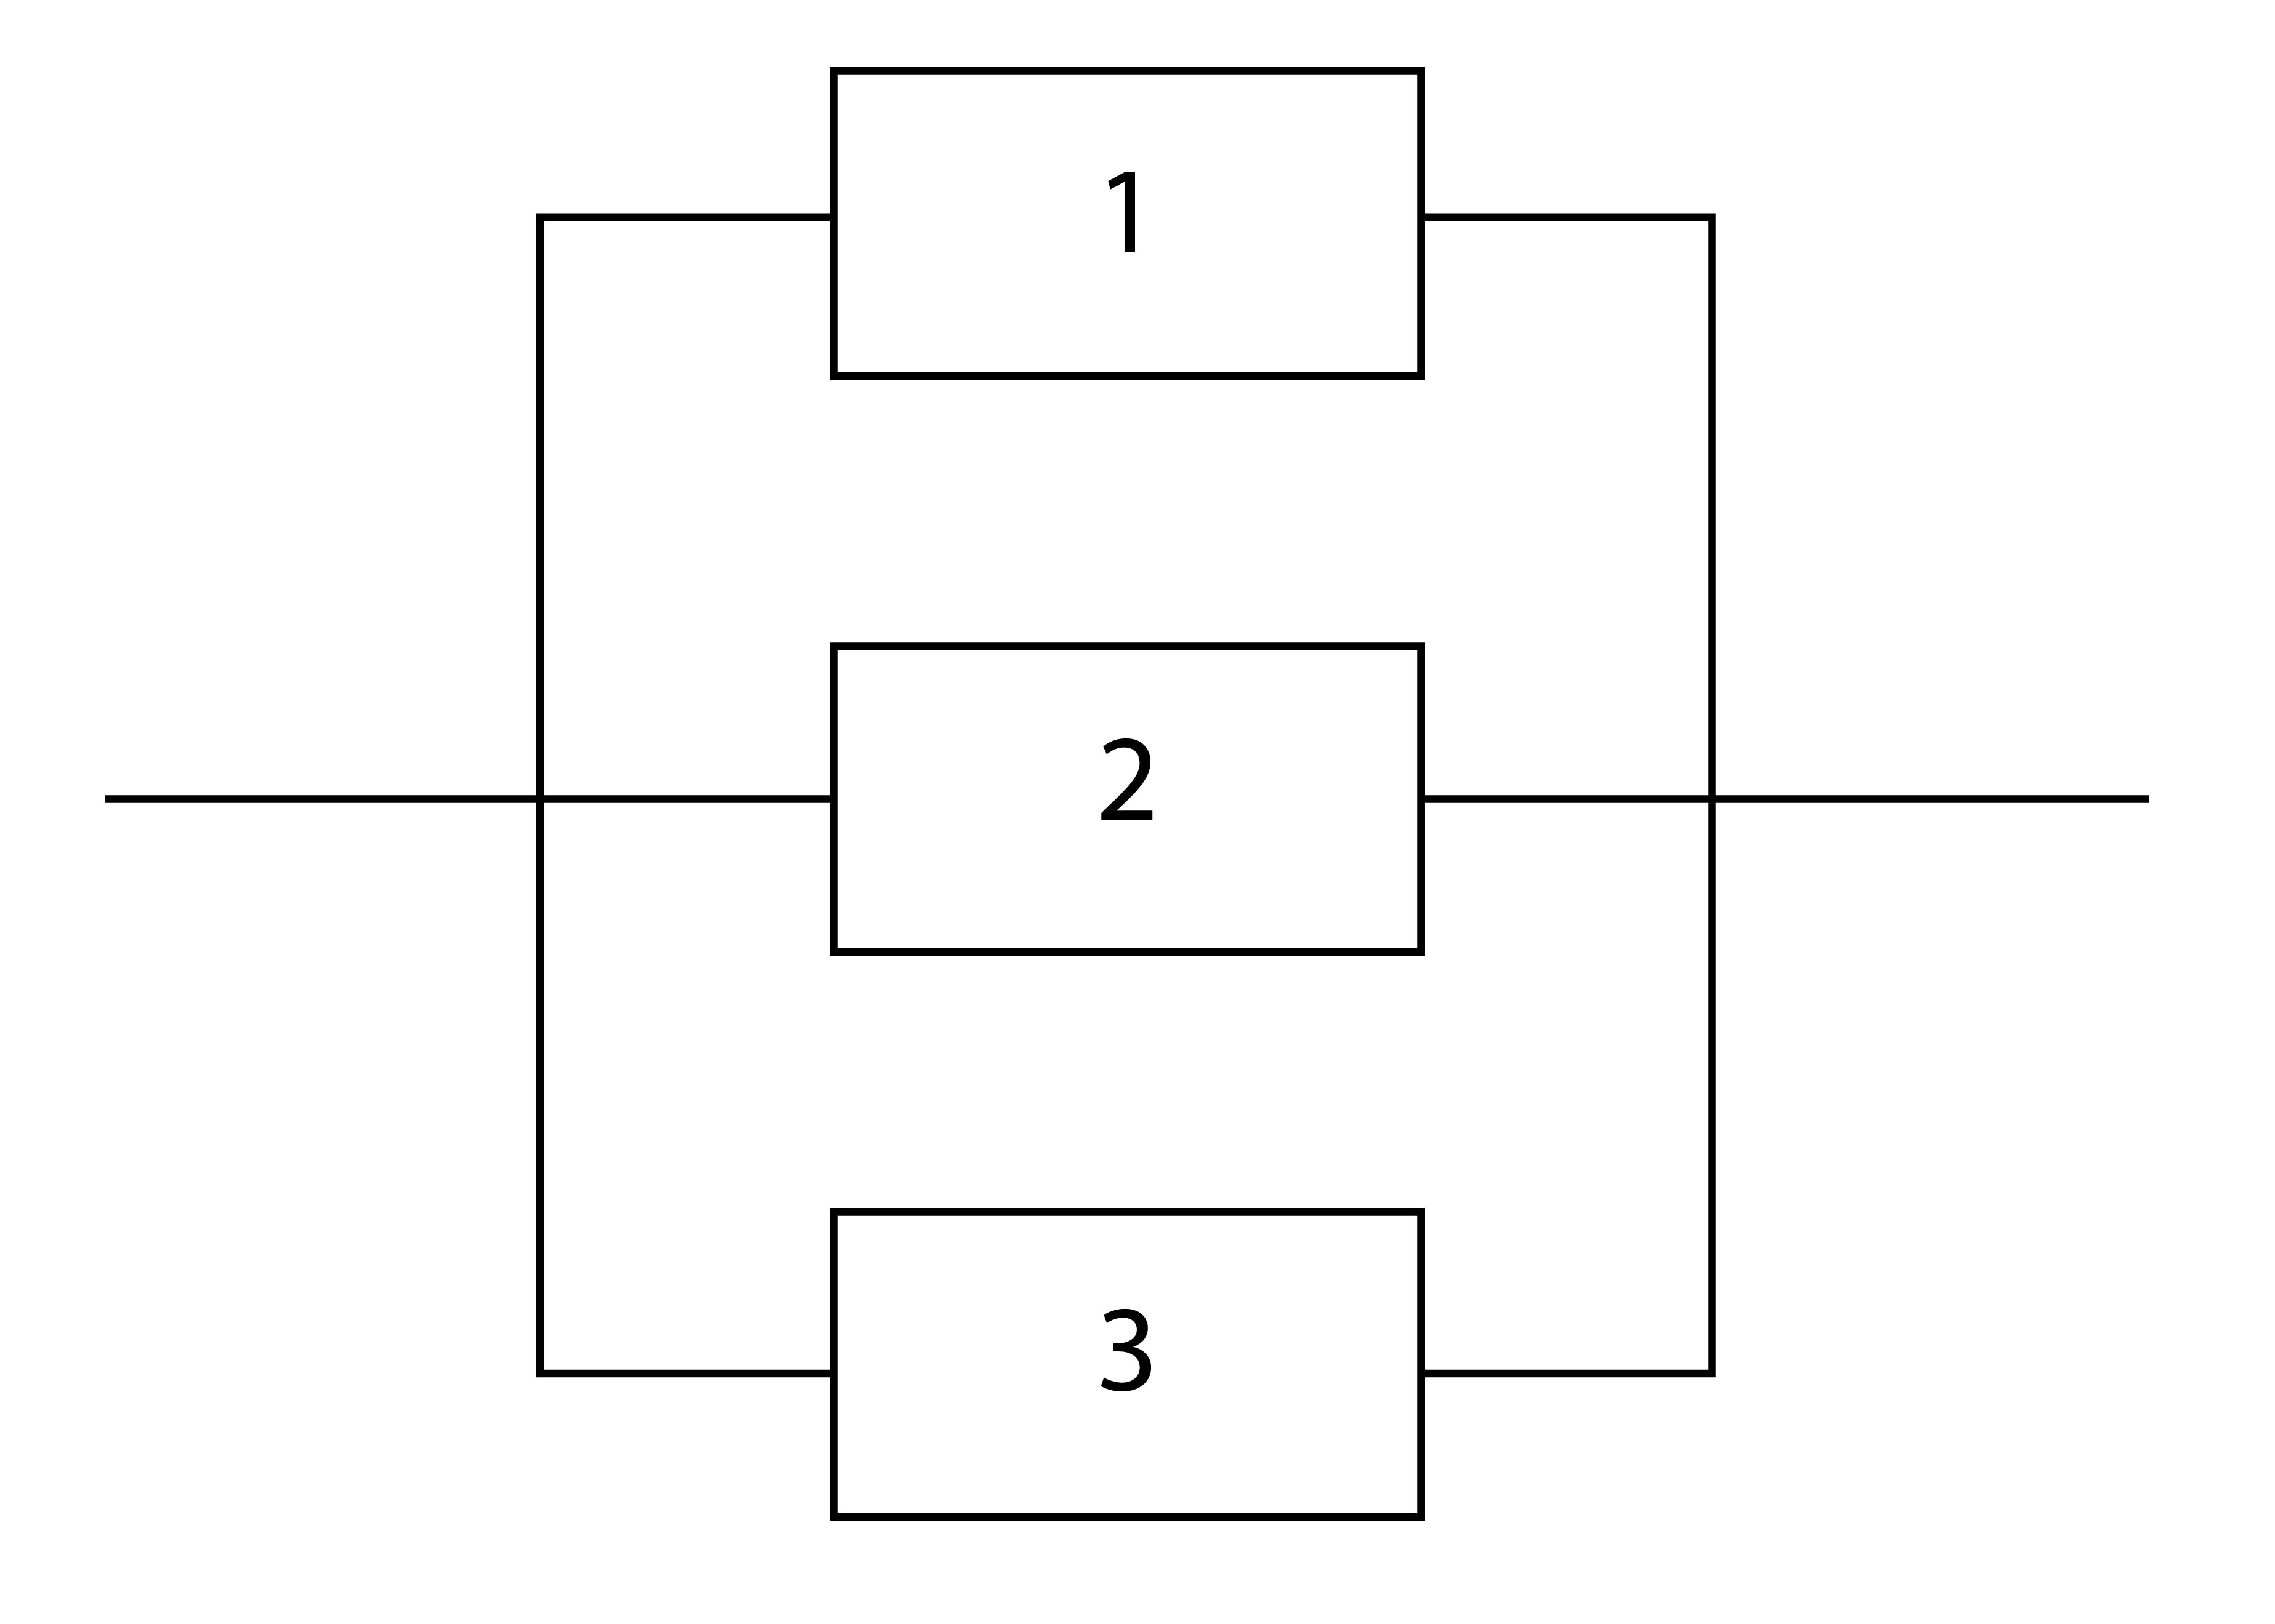
Parallel components
We can see that the “wheel system” is made up of at least three inner systems: a metal wheel, a rubber tire, and an innertube. A nail in the rubber tire can certainly cause the innertube to fail, but you could continue to ride if it was more important to get to where you were going than to prevent any further damage. Saying the bicycle is only 63 percent reliable becomes a meaningless statistic. One of the problems with math and statistics, is that you can dress them up so those not versed in either can be duped by both. We can dress up our probability of failure with impressive formulas:
R = R1 X R2 X R3 X . . . X RN = ΠRJ
and
F = 1 - R
where
R is the overall reliability rate
R1 is the reliability rate of component number 1, and so on
RN is the reliability rate of the last component
ΠRJ is the product of all the reliability rates
F is the probability of failure
And this is for a series system, the easier to consider. The math for a parallel system gets more complicated and when you start blending series and parallel systems, the math gets more complicated still.
You could ask, for example, “What is the probability of failure of my angle of attack system?”
“Well, that depends,” says the expert. “There are at least 100 individual components to consider, each with their own probabilities. But rest assured, we did the math, and we think the chances of a total failure of your AOA system is one in a million.”
I think it is safe to say that if anyone gives you a probability of failure that ends with “in a million,” they don’t know what they are talking about. Our perception of reliability is not only colored by “fuzzy” math, but we are also creatures of how we grow up dealing with mechanical and other tangible objects.
3
Hardware versus software
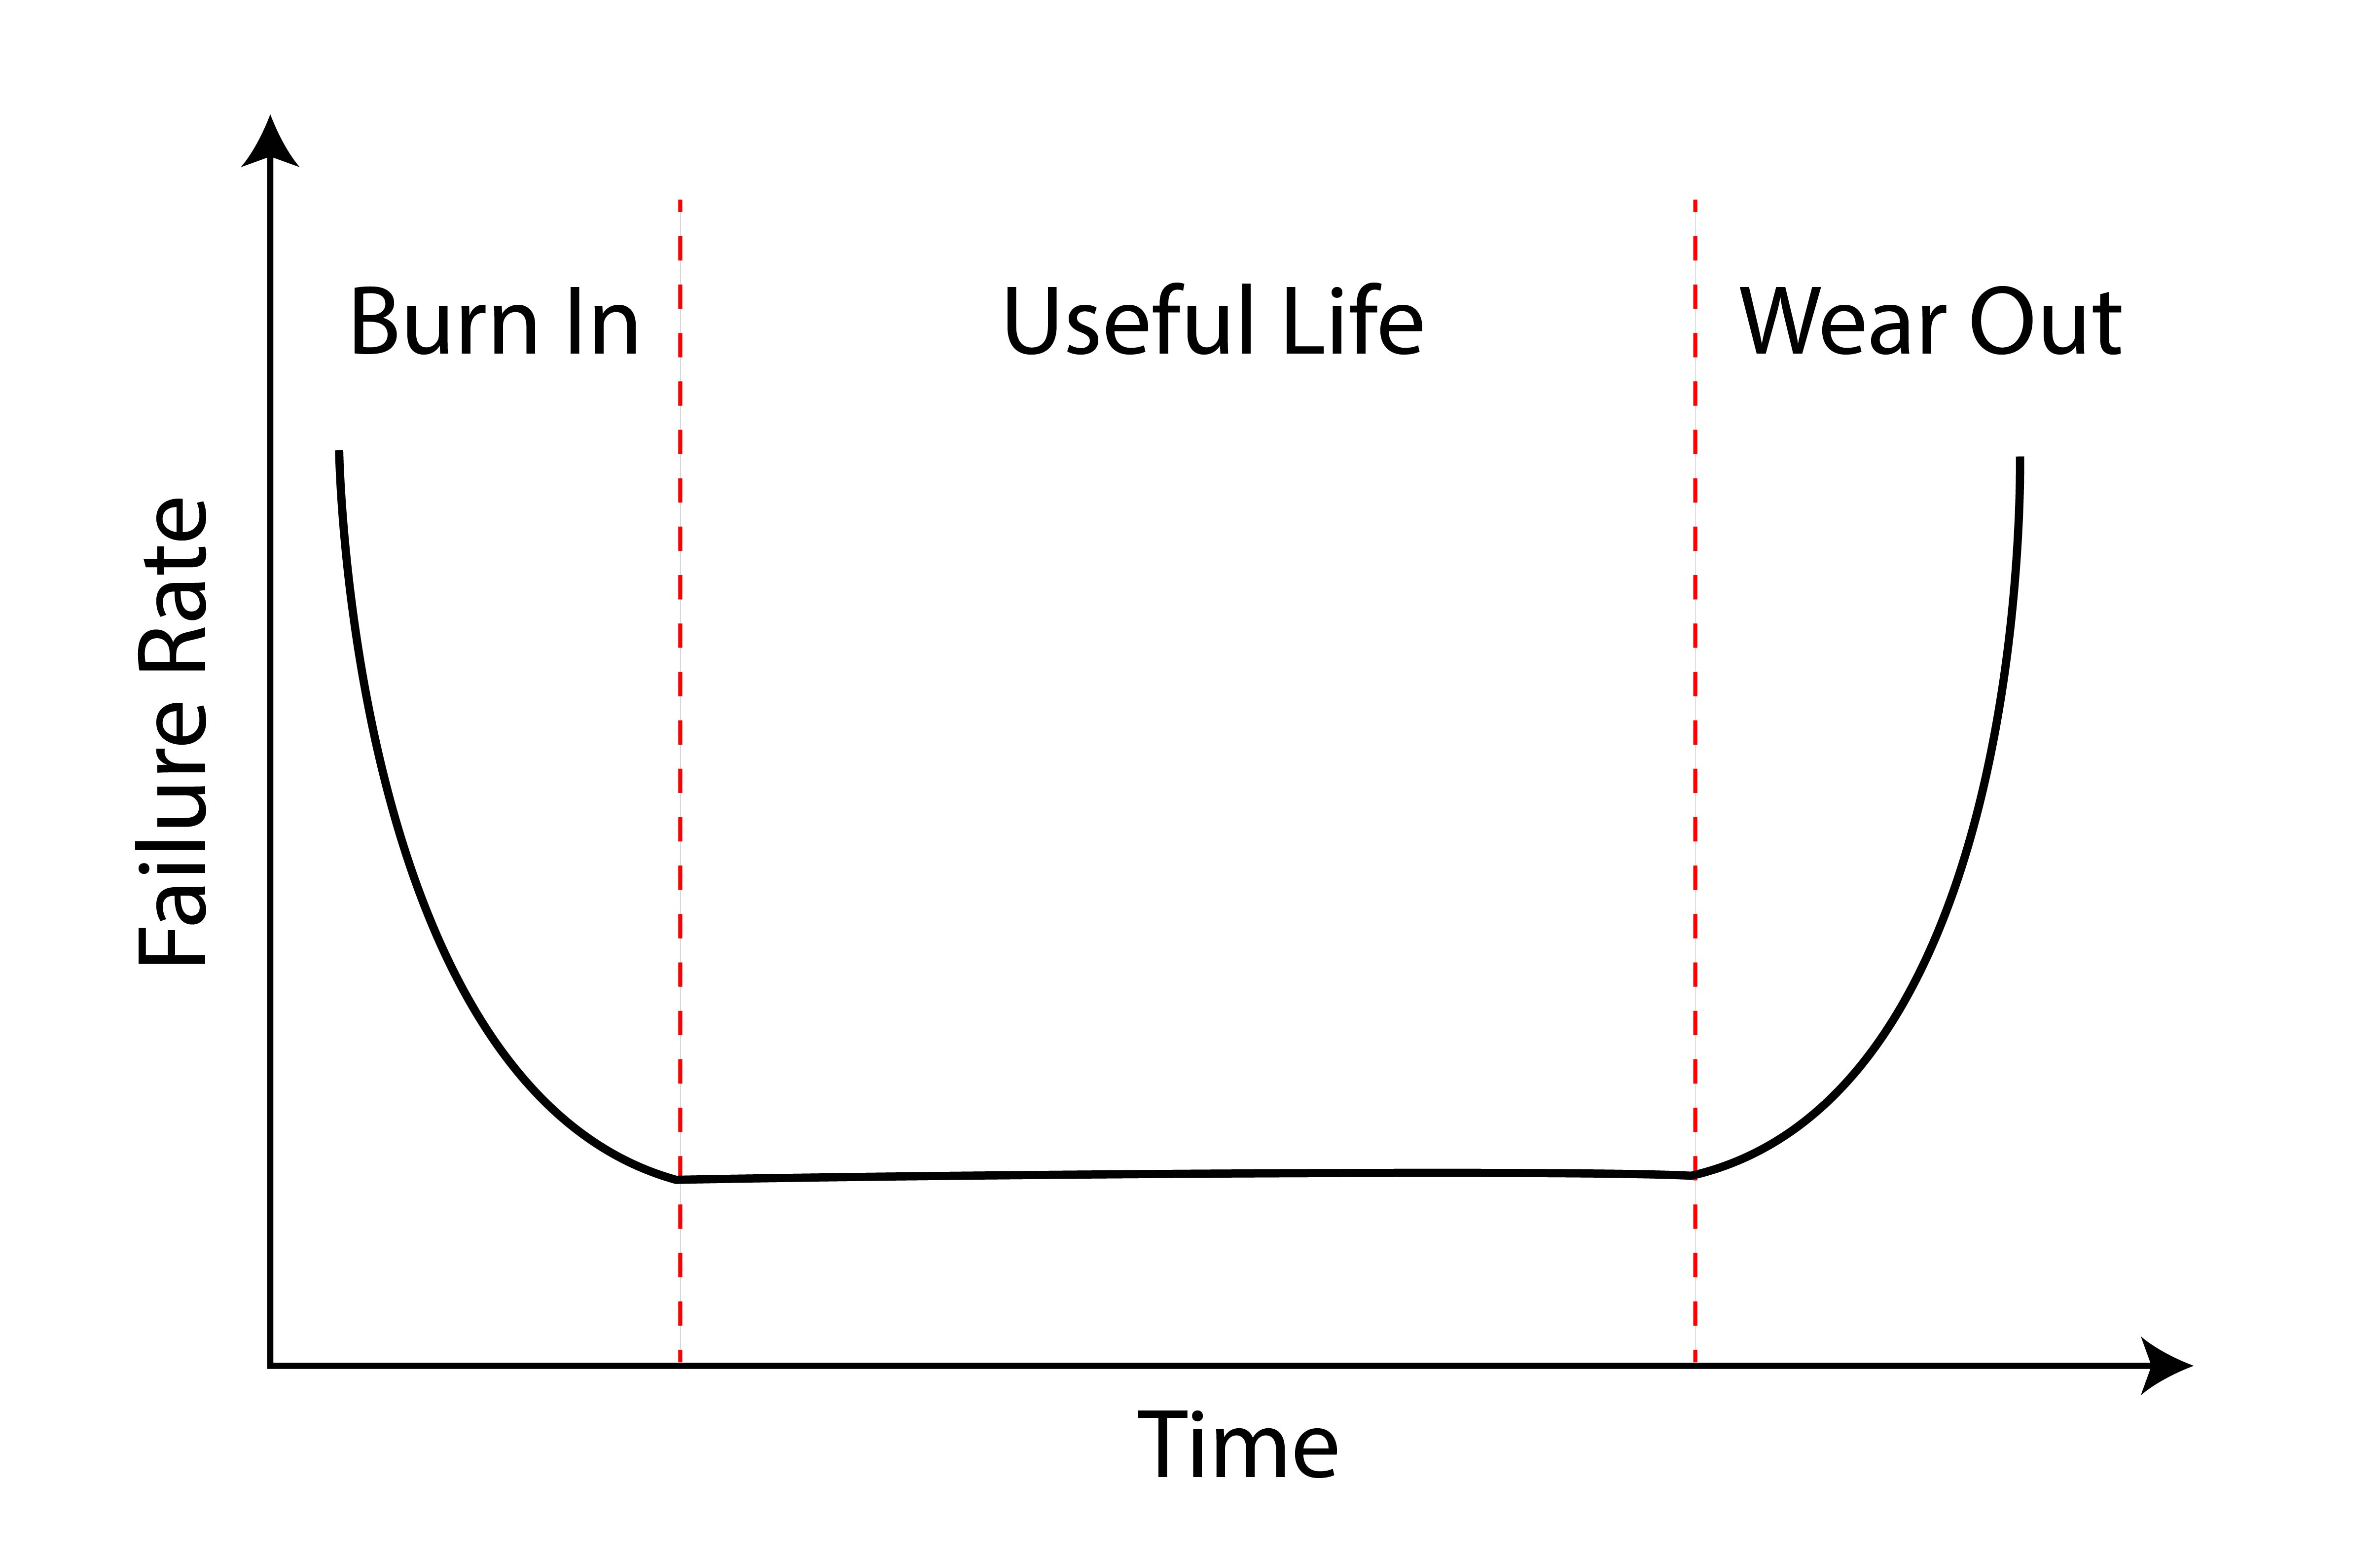
The reliability "bathtub" curve
You don’t have to be an engineer to understand what reliability engineers call the “bathtub curve.” The failure rate of a mechanical system starts high because the designers, builders, and everyone else involved are learning the system and making corrections as they go. As the design, build process, and operational procedures improve, the failure rate drops during the system’s useful life. Finally, the failure rate goes up as the system itself wears out. This makes instinctual sense, and we tend to see this with airplanes too. I’ve certainly seen it during my first decades of flying.
There is an adage in military aviation that says, “Never fly the A-model of anything.” In a twenty-year Air Force career, I flew three A models, including the wonderful Northrop T-38A Talon. The loss rate on that aircraft was just over 7 per year during its first two decades of operational service. Then it dropped every decade since. There is another truism I learned while serving as an aircraft budget officer at the Pentagon, “Never fly an aircraft once the maintenance budget per aircraft has been cut in half.” The Air Force tracks aircraft reliability with a statistic called “Mission Capable,” or the “MC Rate.” During my first year at the Pentagon, the officers in charge of the Lockheed C-141 Starlifter were alarmed by the third consecutive year of budget cuts in the cargo aircraft’s maintenance budget. Their MC Rate fell each year in that period and tarnished the aircraft’s once stellar record. Our handling of the aircraft ran contrary to another truism: “Unless you reduce the number of aircraft, the maintenance budget should go up with age, not down.”
The first production C-141 rolled out of the Lockheed factory in 1963 and the last in 1968. A total of 276 were built. In 1994, I was called by the Vice Chief of Staff of the Air Force (VCSAF) to explain the aircraft’s fall from MC grace. I explained that the chief culprit was the mechanical attitude indicator which tended to fail every twenty hours and that we could end that by installing a glass cockpit which would pay for itself in only two years. VCSAF didn’t like the idea of spending millions on an airplane we planned to retire so the plan was disapproved. The C-141 limped along for years until the last one was retired in 2006, giving the aircraft nearly forty years of service, almost perfectly following the reliability rate predicted by the bathtub chart. But reliability rates on modern aircraft don’t seem to follow the same path. We’ve replaced our bathtub with a worn sawtooth.
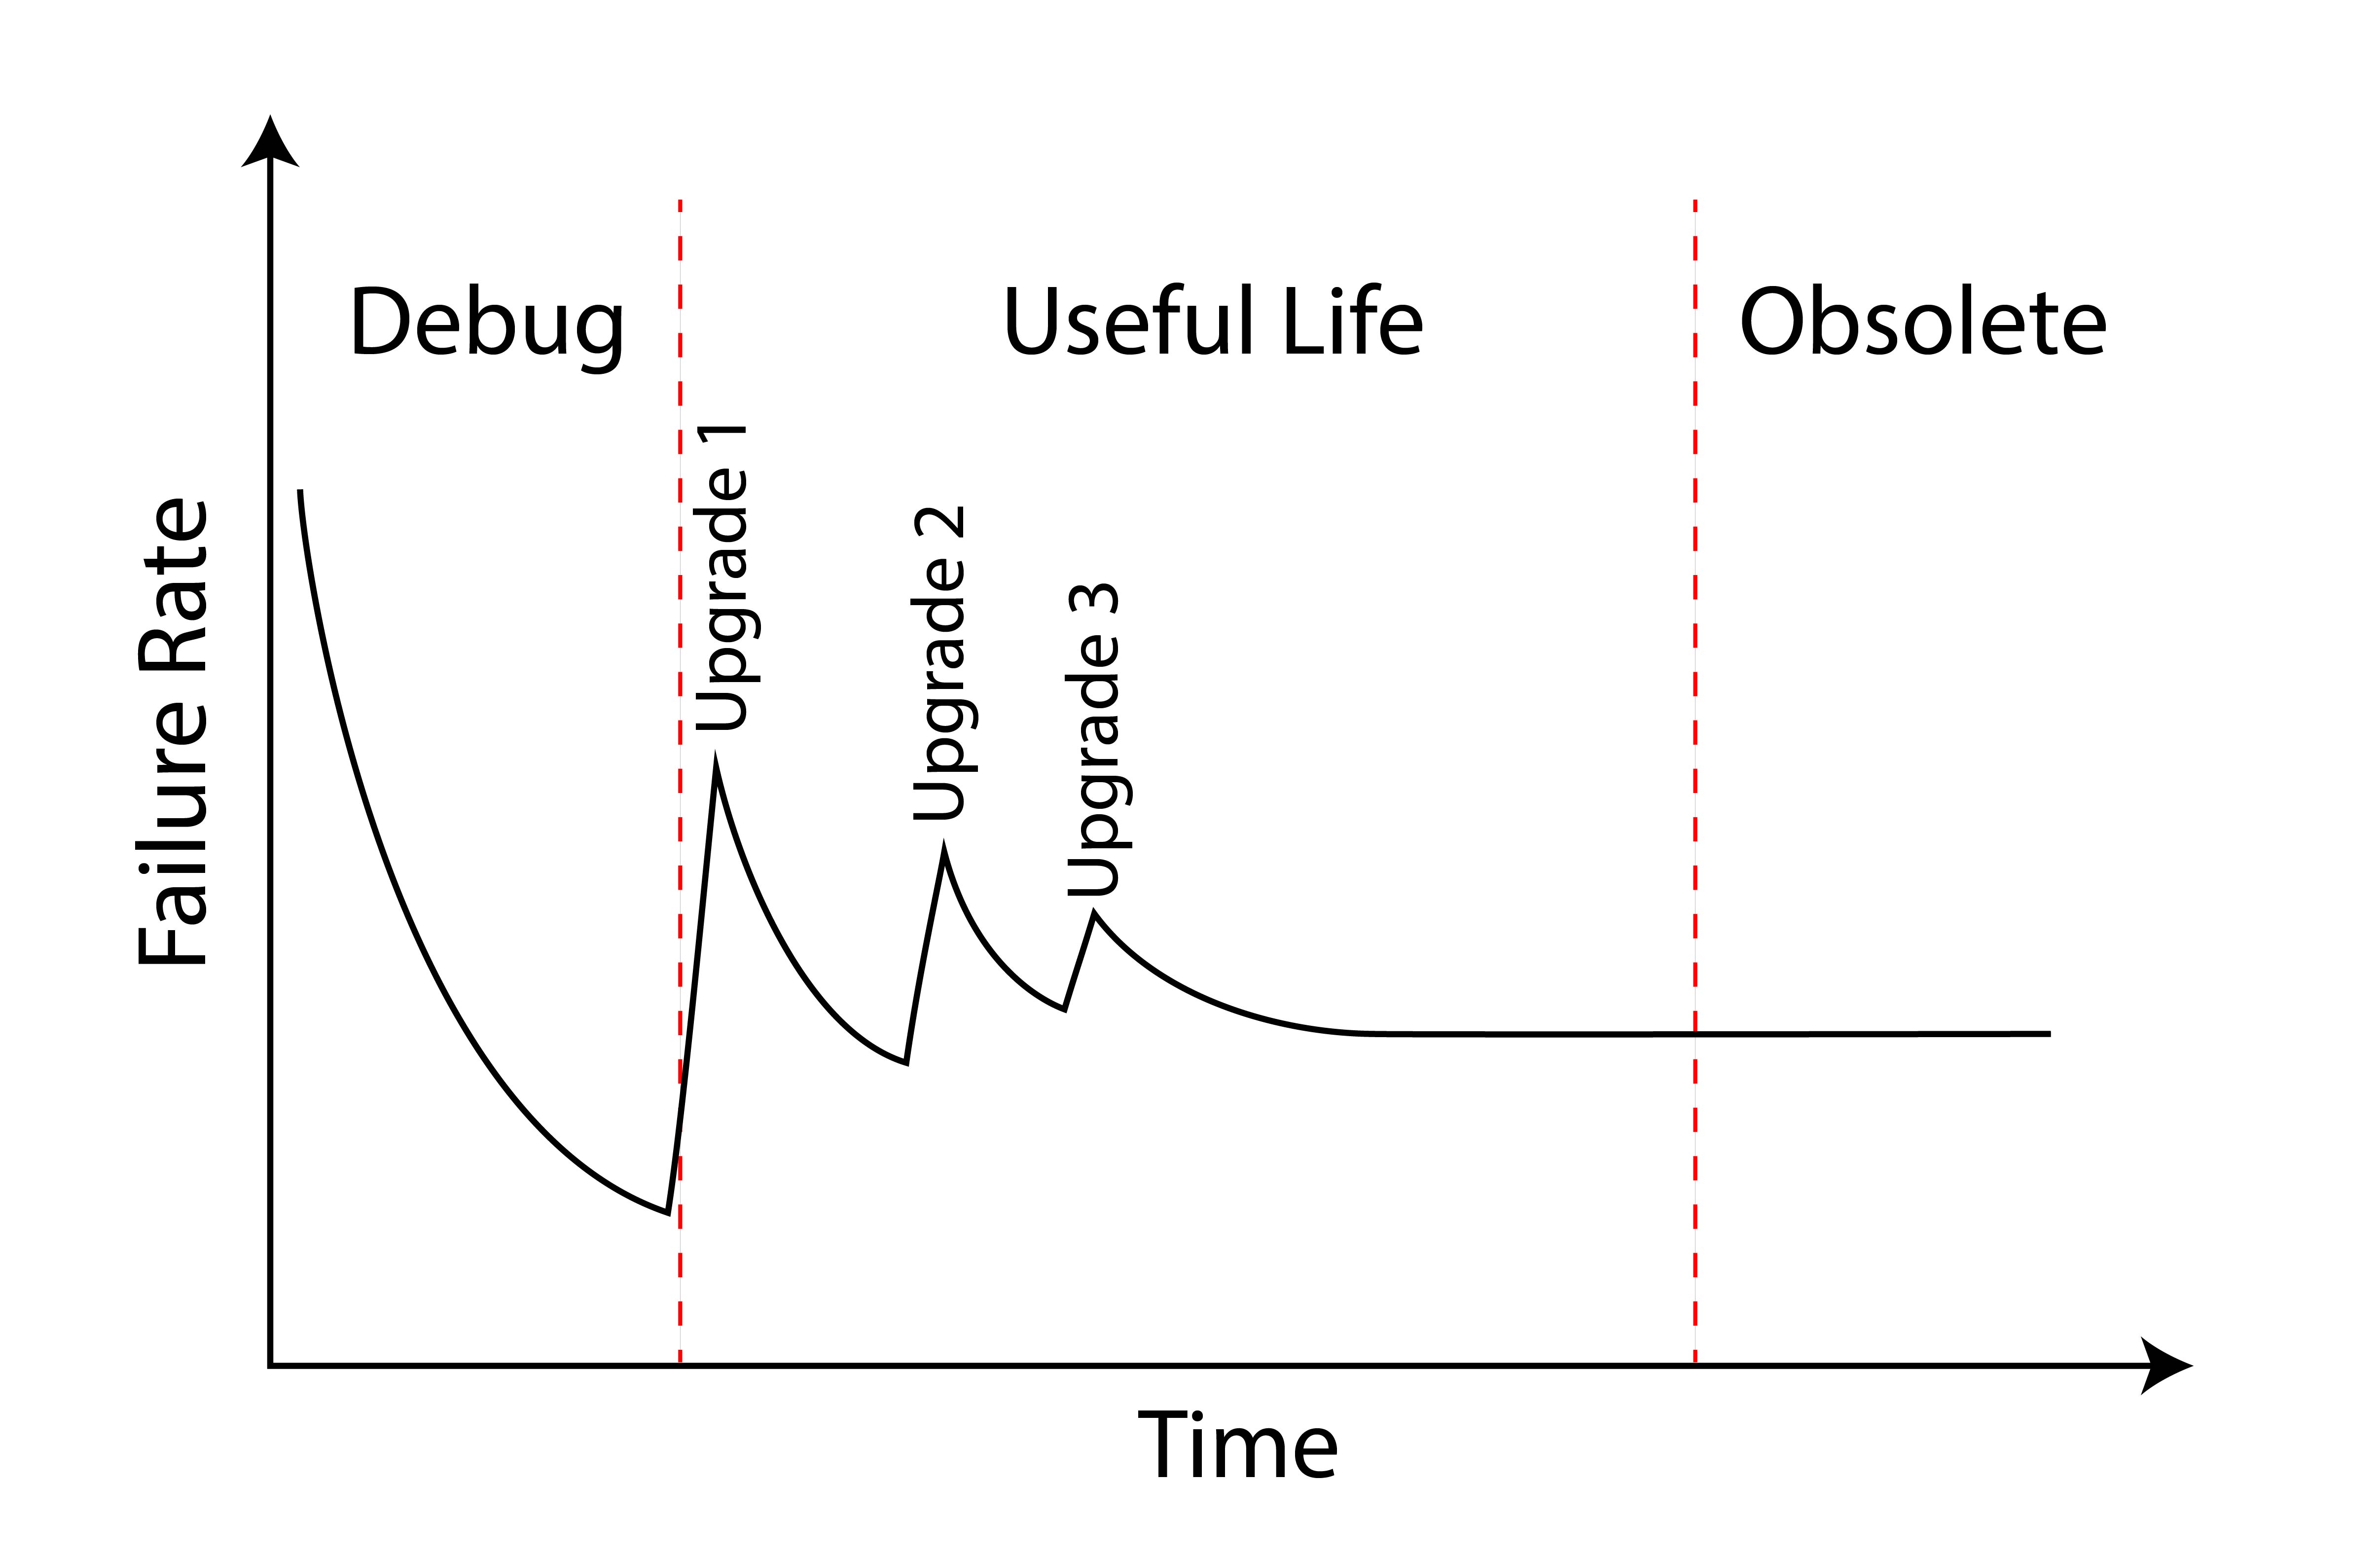
The reliability "worn sawtooth" curve
Our modern aircraft are impacted by computerization in more ways than just the obvious. Yes, many of the systems are computerized. But so is the initial design and ongoing maintenance tracking. We’ve extended the higher early failure rate period because it takes longer to learn where design theory falls short of operational reality. What we used to call the “shakedown” has become “test and debug.”
In 2008, for example, a Qantas Airbus A330 flying from Singapore-Changi International Airport (WSSS) to Perth Airport, Australia (YPPH) pitched nose down violently several times and could have been lost had it not been for the pilot’s quick reactions, systems knowledge, and calm under pressure. A design flaw in the aircraft’s three Air Data Inertial Reference Units (ADIRUs) allowed what is called a “data spike” in a single Angle of Attack (AOA) probe to generate a pitch down command, under very specific and rare circumstances. The flaw, of course, has since been fixed.
More about this flight: Case Study: Qantas 72.
This process of discovery and repair is nothing new, but it seems to happen more often in computerized aircraft. Finding a flaw in millions of lines of software code isn’t easy and the fixes themselves need to be tested. Manufacturers tend to release changes in groups and pilots are often told, “that’s coming in Block Three,” for example. Each new release generates a new cycle of reliability problems, which are hoped to be better than those before. The result is the decreasing spikes of the so-called sawtooth curve.
Just as software has extended the left side of the bathtub curve reliability, computerized design, maintenance, and other tracking software virtually eliminates the right side of that bathtub curve. Many of our failure prone components, like the C-141’s attitude indicator, are now practically failure free computers and displays that should outlast the airframe. We can now predict component failures by reports generated by the components themselves. With few exceptions, we know what to replace or repair before failure. It is the exceptions that we need to worry about.
4
The exceptions we don’t know about
Aircraft reliability is often hard to predict because we are doing things with airplanes we’ve never done before and because the software cannot be fully tested except in actual operational practice. Both factors create exceptions to our ability to anticipate what is going to fail next.
Not too long ago, the realm of flight above 41,000 feet belonged to the experimental crowd and the military. You rarely considered a flight over 10 hours to be wise. And you would certainly never do that over remote areas without alternates or when flying anything that had less than four engines. I had certainly ticked all three boxes early in my career, but never all three at the same time until I first flew the Gulfstream GV. That aircraft was also my first experience with a Heated Fuel Return System (HFRS). These systems return a portion of the fuel heated by engine oil coolers, helping to retard the cooling of the fuel caused by extended flight at high altitudes. We routinely spent 10 to 14 hours at high altitudes where the outside air temperature fell to well below what is considered standard, -56° C. Seeing temperatures below -70° C wasn’t unusual and I once saw -80° C. With the help of the HFRS, the fuel in my tanks never dipped below -33° C. In my experience, the system always worked, and I never worried about fuel freezing because of extended flight at high altitudes.
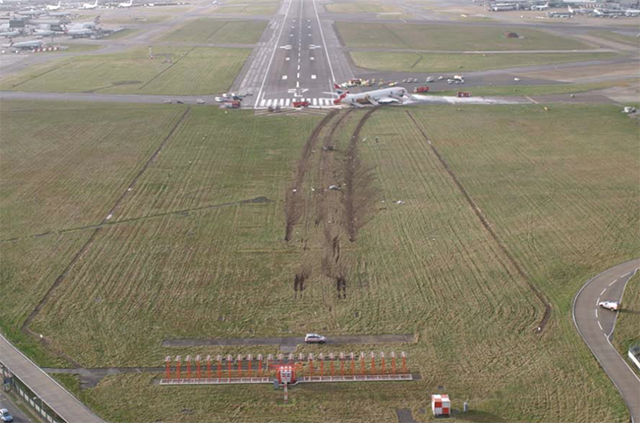
British Airways Flight 38,
from AAIB, figure 1.
I think my attitude was typical back in 2008, when a Boeing 777 crew flying from Beijing Capital Airport, China (ZBAA) to London Heathrow Airport (EGLL). Their aircraft dealt with the problem using a water scavenging system to eliminate water in the fuel tanks, reasoning that without water in the fuel, the fuel wouldn’t freeze. Despite water-free fuel, the aircraft lost thrust on both engines while on short final. The crew did well to land 550 meters short of the runway, damaging the aircraft beyond repair but sparing the lives of all 149 crew and passengers. Subsequent investigation revealed possible fuel restrictions in both engine Fuel Oil Heat Exchangers. Analysis showed that the fuel didn’t freeze but had become “sticky.” Investigators determined that cold fuel tends to adhere to its surroundings between -5° C and -20° C and is most “sticky” at -12° C. The 777’s fuel was actually below these levels until it warmed after the aircraft began its descent, and the stickiness was only a factor once the aircraft needed increased thrust on final approach. The Boeing 777, by this time, had been in operational service for 13 years and compiled an enviable reliability record. But fuel stickiness was something we didn’t have a need to understand before the dawn of this kind of long-distance, high-altitude flight.
More about this flight: British Airways 38.
Another, perhaps more problematic issue to worry about is the complexity of software controlling our aircraft. You may have heard that some daring souls are willing to brave the “beta” version of your favorite software application. These prerelease versions are sent out to users to test in real world conditions, looking for bugs. Some software applications are said to be in “perpetual beta,” meaning they will never really be finished. I think we in the aviation world are doomed to fly perpetual beta releases because our software can never be fully tested except in the real world, because the real world is too complicated to fully predict in a research and development environment.
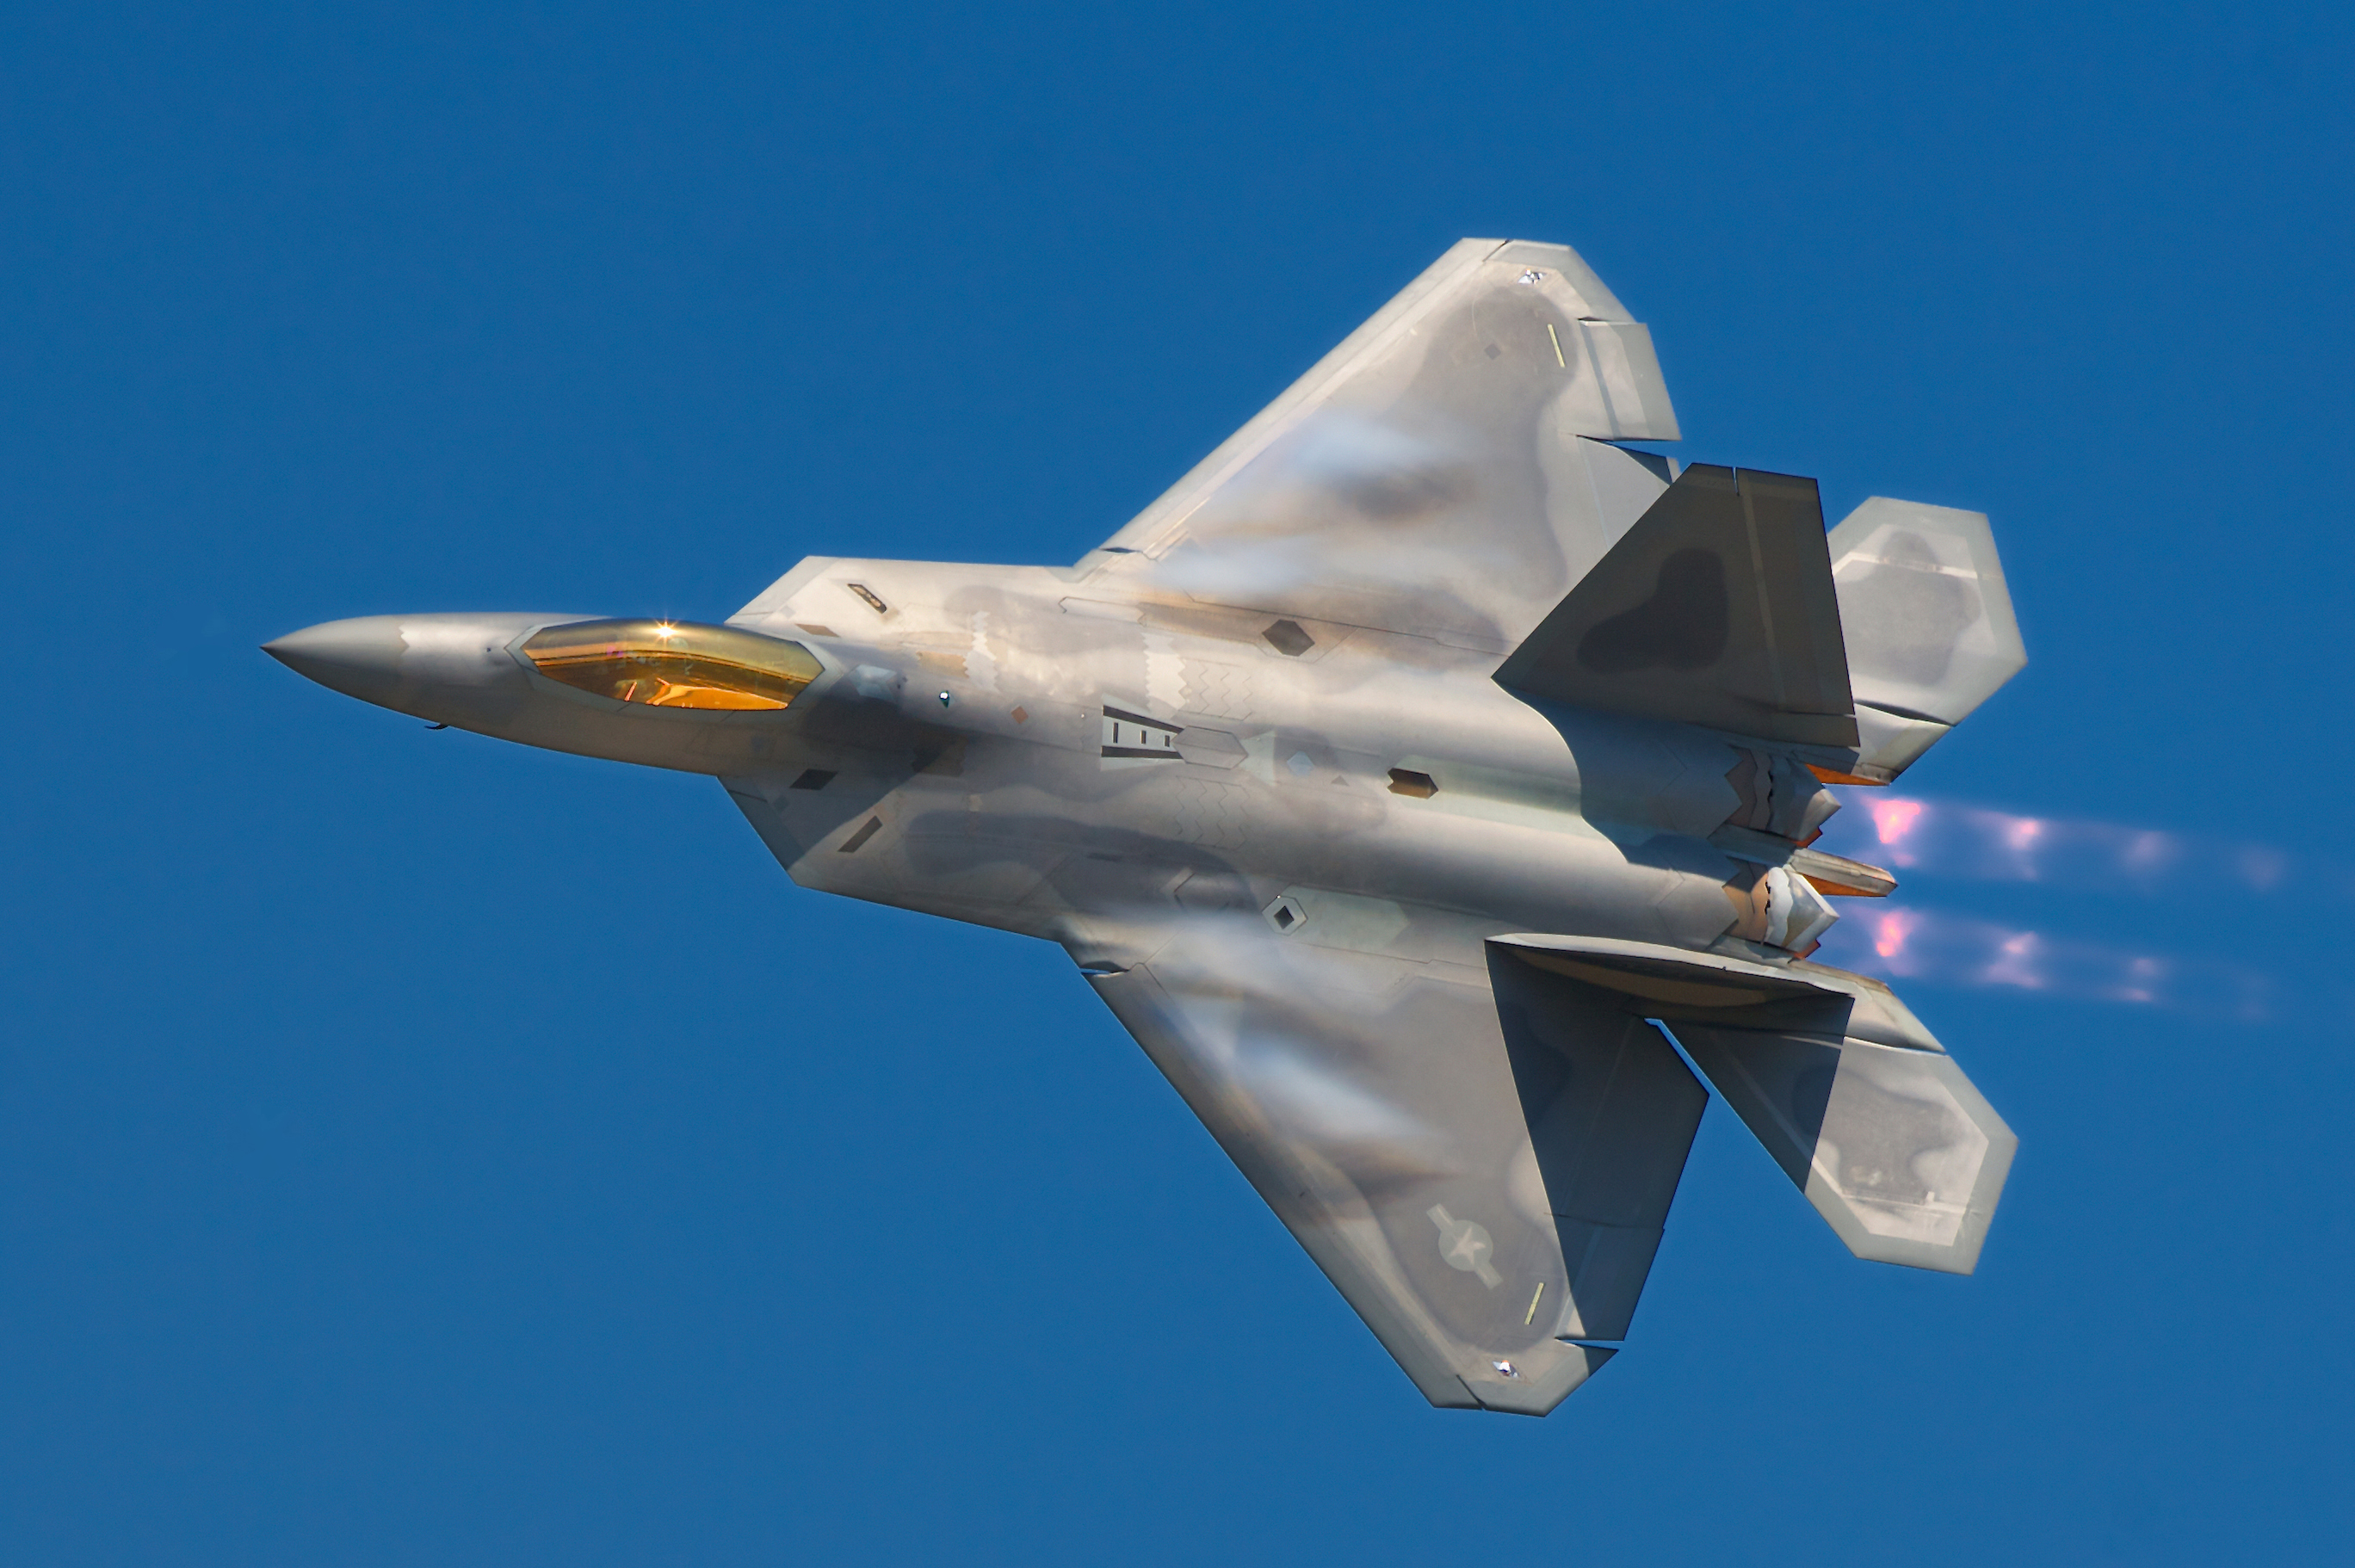
F-22 Raptor, 17 May 2008, (credit: Rob Shenk)
Consider, for example, the Lockheed Martin F-22 Raptor, which was introduced in the U.S. Air Force in 2005 at a cost of $360 million per copy. It was considered such a technological marvel that it was awarded the prestigious Collier Trophy in 2006. The next year, during its first deployment across the International Date Line from Hawaii to Japan, a flight of a half dozen Raptors lost all navigation, communications, and fuel management systems because of what was called a “computer glitch” that seemed to be triggered once crossing the date line. The aircraft were able to visually signal their distress to their air refueling tankers, who escorted them back to Hawaii. The Air Force has never officially explained what caused the glitch, but the fix was instituted within 48 hours.
More about this incident: Technophobe.
How can we, as operators, possibly predict the reliability of our aircraft, given their complexity? More importantly, how can we have faith in predicted reliability given to us in terms of failures per thousands of flight hours or sorties?
5
The pilot’s conundrum
Most pilots with more than a few years flying computerized jets will have heard “you need to reboot” from maintenance when reacting to a problem after initial power up. A reboot for many aircraft involves turning everything off and waiting a few minutes, but some may also require some or all aircraft batteries be disconnected.
I was once in this situation with a horizontal stabilizer and after the reboot was assured the aircraft was safe to fly. “Why did it fail before and not after the reboot?” I asked. “These things happen, don’t worry about it.” I refused to fly the aircraft and further investigation revealed the reboot allowed the software to bypass a System Power-On Self Test (SPOST) of an electrical brake on the stabilizer. I no longer accept “don’t worry about it” when it comes to airplane problems.
I accept that flight itself is not risk free, but I also reject inflated claims of reliability. In the Gulfstream GVII that I fly these days, for example, we are told the fly-by-wire system could degrade from “Normal” to “Alternate” mode if we lose too many air data or inertial references sources, or if the flight control computers lose communications with the horizontal stabilizer system. We are told the probability of this happening is less than “1 per 10 million flight hours.” As an engineer, that makes me think of the claims given for the space shuttle. As a pilot, I think that even if the 1 per 10 million flight hours is true, it doesn’t matter if that particular one hour happens with me in the seat.
The conundrum we face when it comes to critical system reliability is that we just don’t know for sure and that we must often assume the designers have given us an acceptable safety margin. That is the theory that makes all this work. But what of reality?
In both the “fly by cable” T-37 and Airbus A330 fly-by-wire examples, the pilots were presented with situations they had never been trained for and were not addressed in any manuals. They used their systems knowledge to solve their problems. How do we apply these lessons to any aircraft, no matter the complexity?
First, you should do a risk analysis of all systems and identify those that can kill you if they misbehave. I would include any fly-by-wire system that cannot be turned off and controlled manually. You may also want to consider powerplants where the computers have full authority on the shutdown decision. Next, you should realize that you can never know too much about these systems. What you learn in school is just the starting point. Finally, you should be a consumer of all information related to these systems. Studying accident case studies not only helps you to learn from the mistakes of others, it also reveals to you the magic trick performed by quick thinking pilots dealing with aircraft once thought to be as reliable as yours.
References
(Source material)
Accident to Boeing 777-236, G-YMMM at London Heathrow Airport on 17 January 2008, United Kingdom, Department of Transport, Air Accident Investigation Branch, Report 1/2010.