I took my first aeronautical engineering class in 1975 and I still know the formula for lift. Not because I have a head for formulas and not because I have a good memory. (I don't.) I have this knowledge because I once heard the story about The Man Who Invented Lift.
— James Albright
Updated:
2022-11-21
But before we get to Bernoulli, we need to consider Sir Isaac Newton. I think the best way to understand what lift really is, begins with an engineering consideration of energy, which leads to Bernoulli's Equation for Subsonic Air Flow, and ends with an equation for the generation of lift.
1 — Potential and kinetic energy
1
Potential and kinetic energy
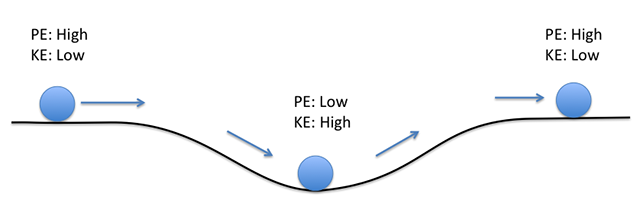
PE vs. KE, a ball on a ramp
Consider for a moment a metal ball traveling at a constant speed on a flat surface approaching a dip, as shown in the drawing. As we did in freshman engineering class, we say the ball and the surface are both frictionless and there is no air resistance for the sake of this academic exercise.
We know that as the ball goes down the dip in the surface, its speed will increase until it gets to the bottom where it will trade that extra speed to climb the ramp. When it ends up back at the original level, since we are discounting the effect of friction, it will again be at its original speed.
Before it hits the slope, the energy of the ball can be described as the Kinetic Energy (KE) that comes from its motion and the Potential Energy (PE) due to its higher elevation.
Continuity Equation
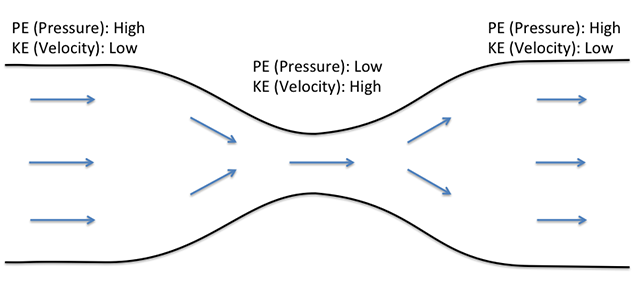
PE vs KE, airflow in a tube
Consider the flow of air through a pipe of varying cross section, as shown [in the figure]. There is no air flow through the sides of the pipe; air only flows through the ends. As the air flown through the pipe, the mass of air entering the pipe, in a given unit of time, equals the mass of the air leaving the pipe, in the same unit of time. The mass flow throughout the pipe must remain constant. The mass flow at each station is equal. Constant mass flow is called steady-state flow. The mass airflow is equal to the volume of air multiplied by the density of the air. The volume of air, at any station, is equal to the velocity of the air multiplied by the cross sectional area of the station. The mass airflow, then, is the product of the density, the area, and the velocity.
The continuity equation states that the mass airflow is constant.
[where station 1 is the inlet, station 2 is the midpoint, and station 3 is the outlet.]
The continuity equation is valid for steady-state flow, both in subsonic and supersonic flow. For subsonic flow, however, the air is considered to be incompressible, and its density remains constant. The density can be cancelled out and thus:
Source: Dole, pg. 19
2
Bernoulli's equation
The energy of an airstream is in two forms. It has a potential energy, which is its static pressure, and a kinetic energy, which is its dynamic pressure. The total pressure in the airstream is the sum of the static pressure and the dynamic pressure. The total pressure remains constant, according to the law of conservation of energy, and so an increase in one form of pressure must result in a decrease of the other.
The units of q are:
which is psf.
Pilots are much more familiar with velocity measured in knots, rather than in feet per second, so a new formula for dynamic pressure is used.
or
so
Bernoulli's formula can now be expressed as:
It can now be seen that air flowing into a reduced area section of a venturi tube will increase in velocity, according to the continuity equation, and will have a decrease in static pressure, according to Bernoulli's equation.
Source: Dole, pg. 20
3
Velocity and static pressure changes about an airfoil
Airflow over a wing
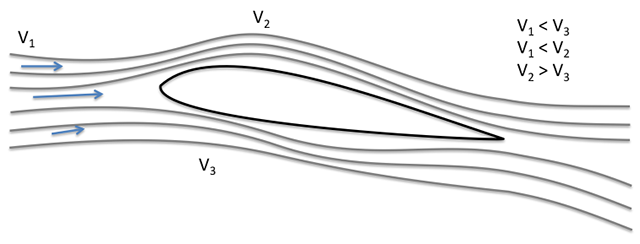
If you split the experimental venturi tube in half, you end up with what looks like the cross section of an airfoil which behaves like the tube. This can be verified in wind tunnel tests.
The air approaching the leading edge of an airfoil is first slowed down. It then speeds up again as it passes over or beneath the airfoil. [The figure] shows a comparison of two local velocities with the flight path velocity V1 and with each other.
As the velocity changes, so does the dynamic pressure and, according to Bernoulli's principle, so does the static pressure. Air near the stagnation point has slowed down, and thus the static pressure in this region is higher than the ambient static pressure. Air that is passing above and below the airfoil, and thus has speeded up to a value higher than the flight path velocity, will produce static pressures that are lower than ambient static pressure. At a point near maximum thickness, maximum velocity and minimum static pressure will occur. Because air has viscosity, some of its energy will be lost to friction and a "wake" of low velocity, turbulent air exists near the trailing edge, resulting in a small, high pressure area.
The shape of the wing directly impacts the airflow. While the science of wing shape has become very complicated, a few basic terms will help us understand how the airfoil produces lift and, more importantly, when it stops.
Source: Dole, pg. 29
Airfoil terminology
Terminology
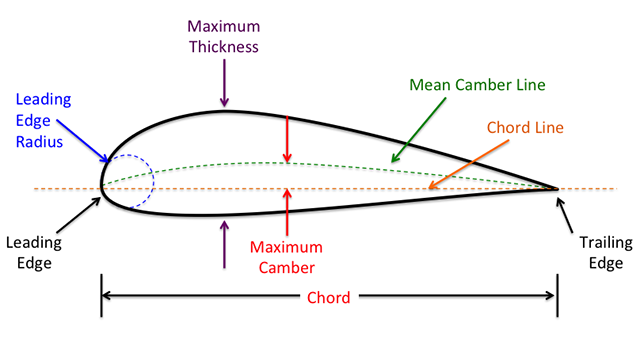
If we take a cross section of a wing we can define the shape with some airfoil terminology:
- Chord Line. The chord line is a straight line connecting the leading and trailing edges of the airfoil.
- Chord. The chord is the characteristic dimension of the airfoil.
- Mean-camber Line. The mean-camber line is a line drawn halfway between the upper and lower surfaces.
- Maximum Camber. Maximum camber is the maximum distance between the mean camber line and the chord line.
- Maximum Thickness. Maximum thickness refers to the maximum distance between the upper and lower surface.
- Leading Edge Radius. Leading edge radius is a measure of the sharpness of the leading edge of the wing.
Terminology
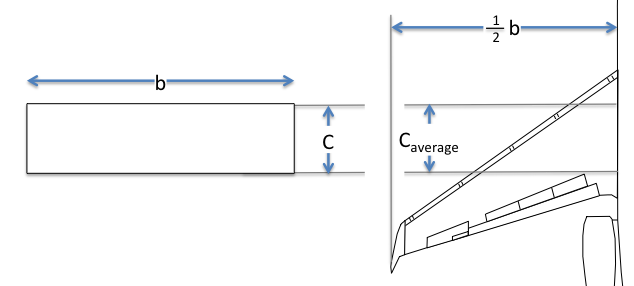
Looking at the wing from the top, the shape is called the planform of the wing. Because wings have become very complicated, it is helpful to simplify a drawing to help define the appropriate terms.
- The wing area S is the plan surface area including the area covered by the fuselage or nacelles.
- The wing span b is the distance from tip to tip.
- The average chord caverage is the geometric average chord. Span x average chord = wing area (b x caverage = S).
Source: Dole, pg. 50
The formulas, of course, are generalized and would have to be tailored for the exact shape of an aircraft's wing but the simplified formula will come in handy when constructing lift / drag curves.
There are four main variables in the geometry of an airfoil:
- Shape of the mean camber line. If the mean camber line coincides with the chord line., the airfoil is said to be symmetrical. In symmetrical airfoils, the upper and lower surfaces have the same shape and are equidistant from the chord line.
- Thickness.
- Location of maximum thickness.
- Leading edge radius.
Source: Dole, pg. 26
Terminology
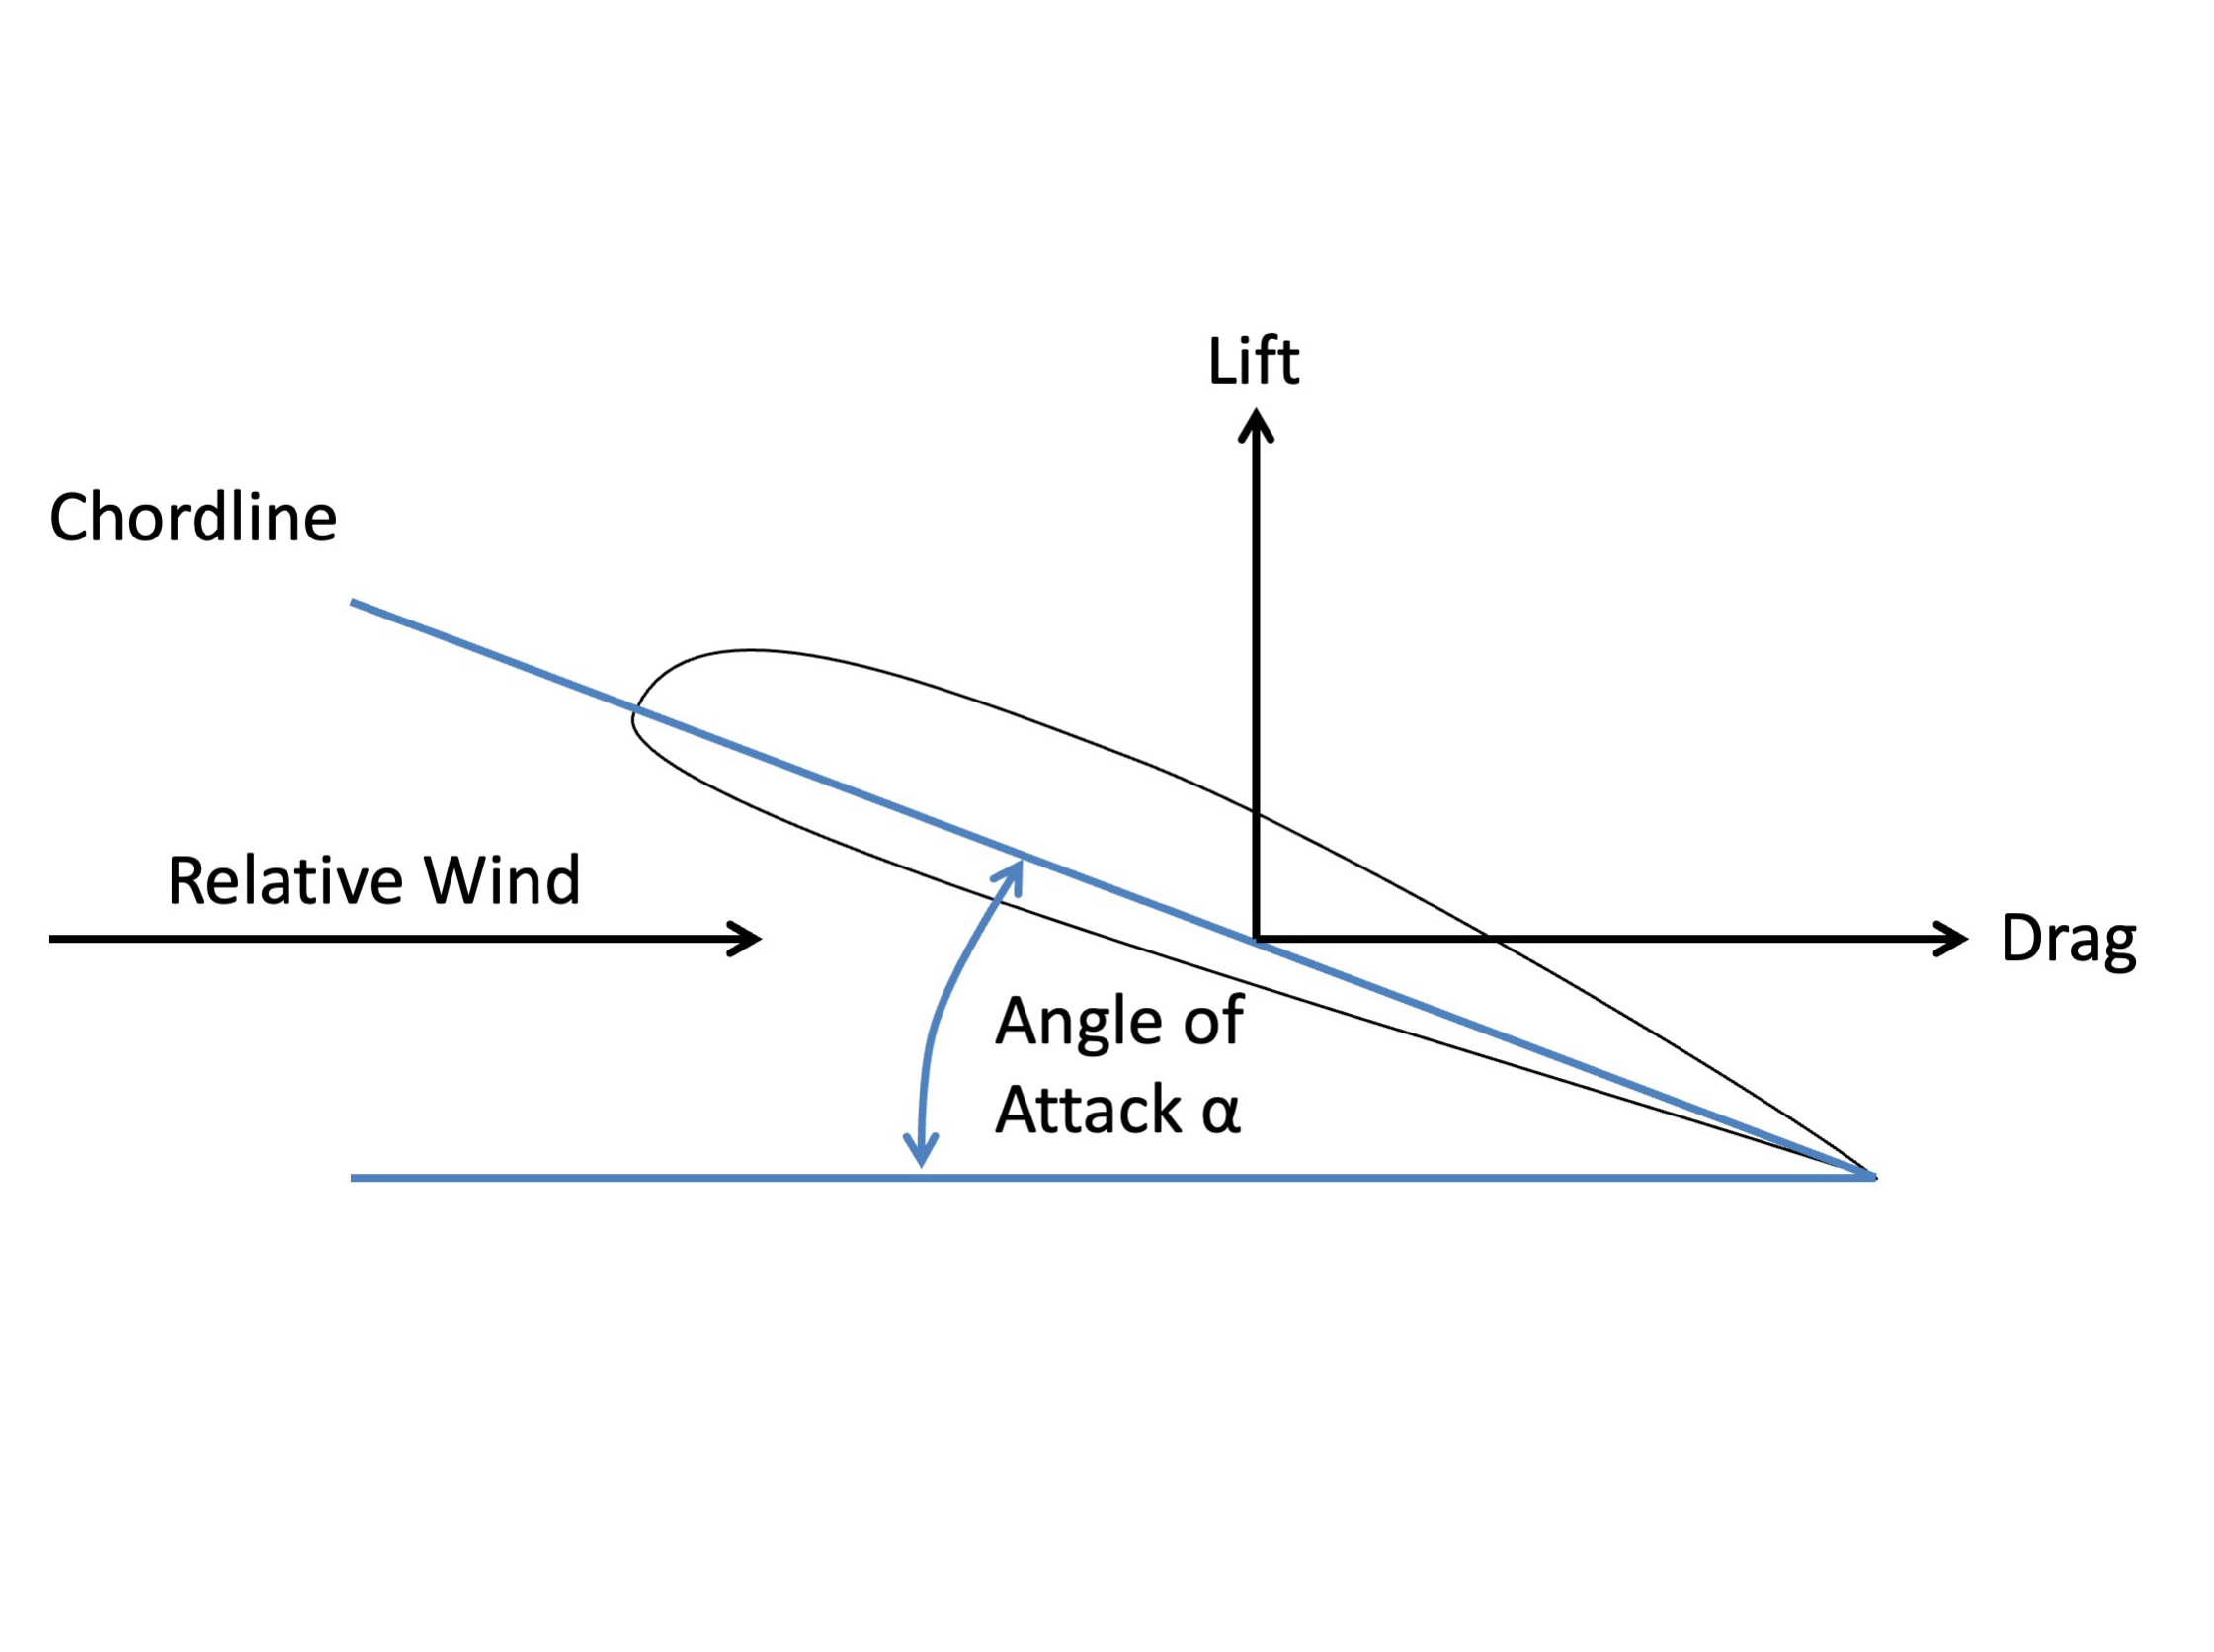
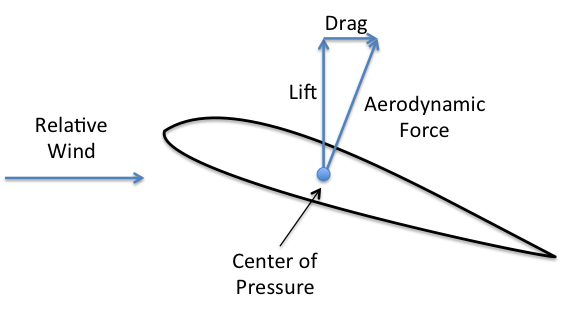
- The lift produced by an airfoil is the net force produced perpendicular to the relative wind.
- The drag incurred by an airfoil is the net force produced parallel to the relative wind.
- The angle of attack is the angle between the chord line and the relative wind.
Source:Hurt, pg. 22
4
Aerodynamic force
Aerodynamic force
Aerodynamic Force (AF) is the resultant of all static pressures acting on an airfoil in an airflow, multiplied by the planform area that is affected by the pressure. The line of action of the AF passes through the chord line. at a point called the center of pressure (CP).
Source: Dole, pg. 30
AF is resolved into two components, one parallel to the relative wind and called drag, and the other perpendicular to the relative wind and called lift.
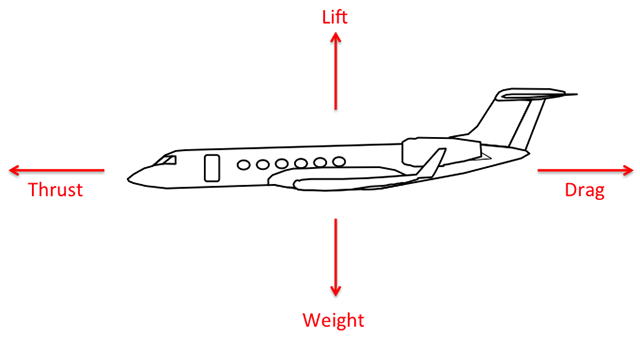
"Fictitious" forces
The forces you see on a conventional "Lift / Weight / Thrust / Drag" drawing include two fictitious forces: lift and drag do not really exist as shown. While they are useful for the sake of discussion, they are not real.
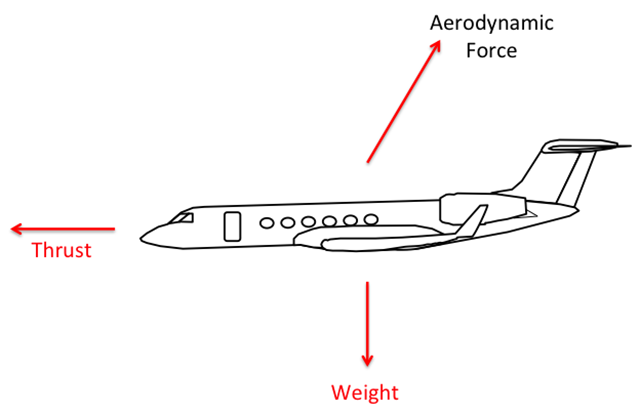
"Real" forces
Lift and drag are actually components of Aerodynamic Force.
The aerodynamic force includes:
- All of the force directed up and aft as a result of the entire wing and fuselage. Formulas are simplified in an academic setting to assume the wing span includes the area between the wing roots, the fuselage. While most fuselages do offer a bit of "lift" they may not be a productive as the wing itself.
- All of the retarding force known simply as drag. This includes the induced drag caused by the down wash effects of the wing tip vortices as well as the parasite drag of the airframe itself.
5
Dynamic Pressure
What is dynamic pressure?
The energy of an airstream is in two forms. It has potential energy, which is the static pressure, and a kinetic energy, which is its dynamic pressure.
Dynamic pressure q corresponds to kinetic energy in mechanics and is expressed by the formula:
Source: Dole, p. 20
Kinetic energy is the energy that comes from motion, so we can think of dynamic pressure as the pressure on the wing surfaces due to its movement through the air.
Why is dynamic pressure important?
The lift and drag equations depend on several factors, the most important of which are:
- Airstream velocity V (knots).
- Airstream density ratio σ (Dimensionless)
- Planform area S (ft2).
- Profile shape of the airfoil.
- Viscosity of the air.
- Compressiblity effects.
- Angle of attack α (degrees)
Source: Dole, pg. 34
The planform area can be thought of as the "noontime shadow" of the wing, simply the area of the wing in two dimensions. The viscosity of the air is the internal friction of the air caused by the molecular attraction of the surface and the air, which makes it resist the tendency to flow.
Taking the formula for dynamic pressure presented above and substituting known values for ρ we can come up with a more useful equation . . .
The first two factors determine the dynamic pressure q of the airstream, as per equation 2.14:
Factors 4, 5, and 6 influence the amount of drag that an airfoil will develop at a certain AOA.
Source: Dole, pg. 34
6
The Coefficient of Lift
CL
It is convenient to express the lift and drag forces in terms of nondimensional coefficients that are functions of AOA. These are called the coefficient of lift (CL) and the coefficient of drag (CD).
CL can be said to be "the ratio between the lift pressure and the dynamic pressure."
Source: Dole, pg. 34
In other words, the coefficient of lift is the ratio of the pressure generating lift to the pressure all around the wing.
The concept of using the coefficient of lift for determining a wing's ability to generate lift may not have started with Otto Lilienthal, but he was probably the first to quantify it.
[In 1891], Otto Lilienthal had used a whirling arm apparatus to measure the lift and drag for various airfoils approximating the shape of birds' wings. The Wright brothers used his data in the design of their 1900 and 1901 gliders. It is a familiar fact that because they obtained substantially less lift with their gliders than they had predicted with Lilienthal's results, the Wrights resolved to obtain their own data. What is less well known is that in the course of their program they determined that Lilienthal's data were essentially correct.
Figure 2 shows the close agreement between the measurements of Lilienthal and those of the Wrights for the same parabolic airfoil. They are expressed here in the modern terms, lift coefficient (lift force divided by the dynamic pressure and area) as a function of the angle of incidence between the flow and the airfoil. The shift of the Wrights' view from their initial belief that Lilienthal's data were seriously in error, to the recognition that their own results agreed with his, is a superb illustration of the objective and thoroughly professional fashion in which they carried out their work.
Source: Wolko, p. 20
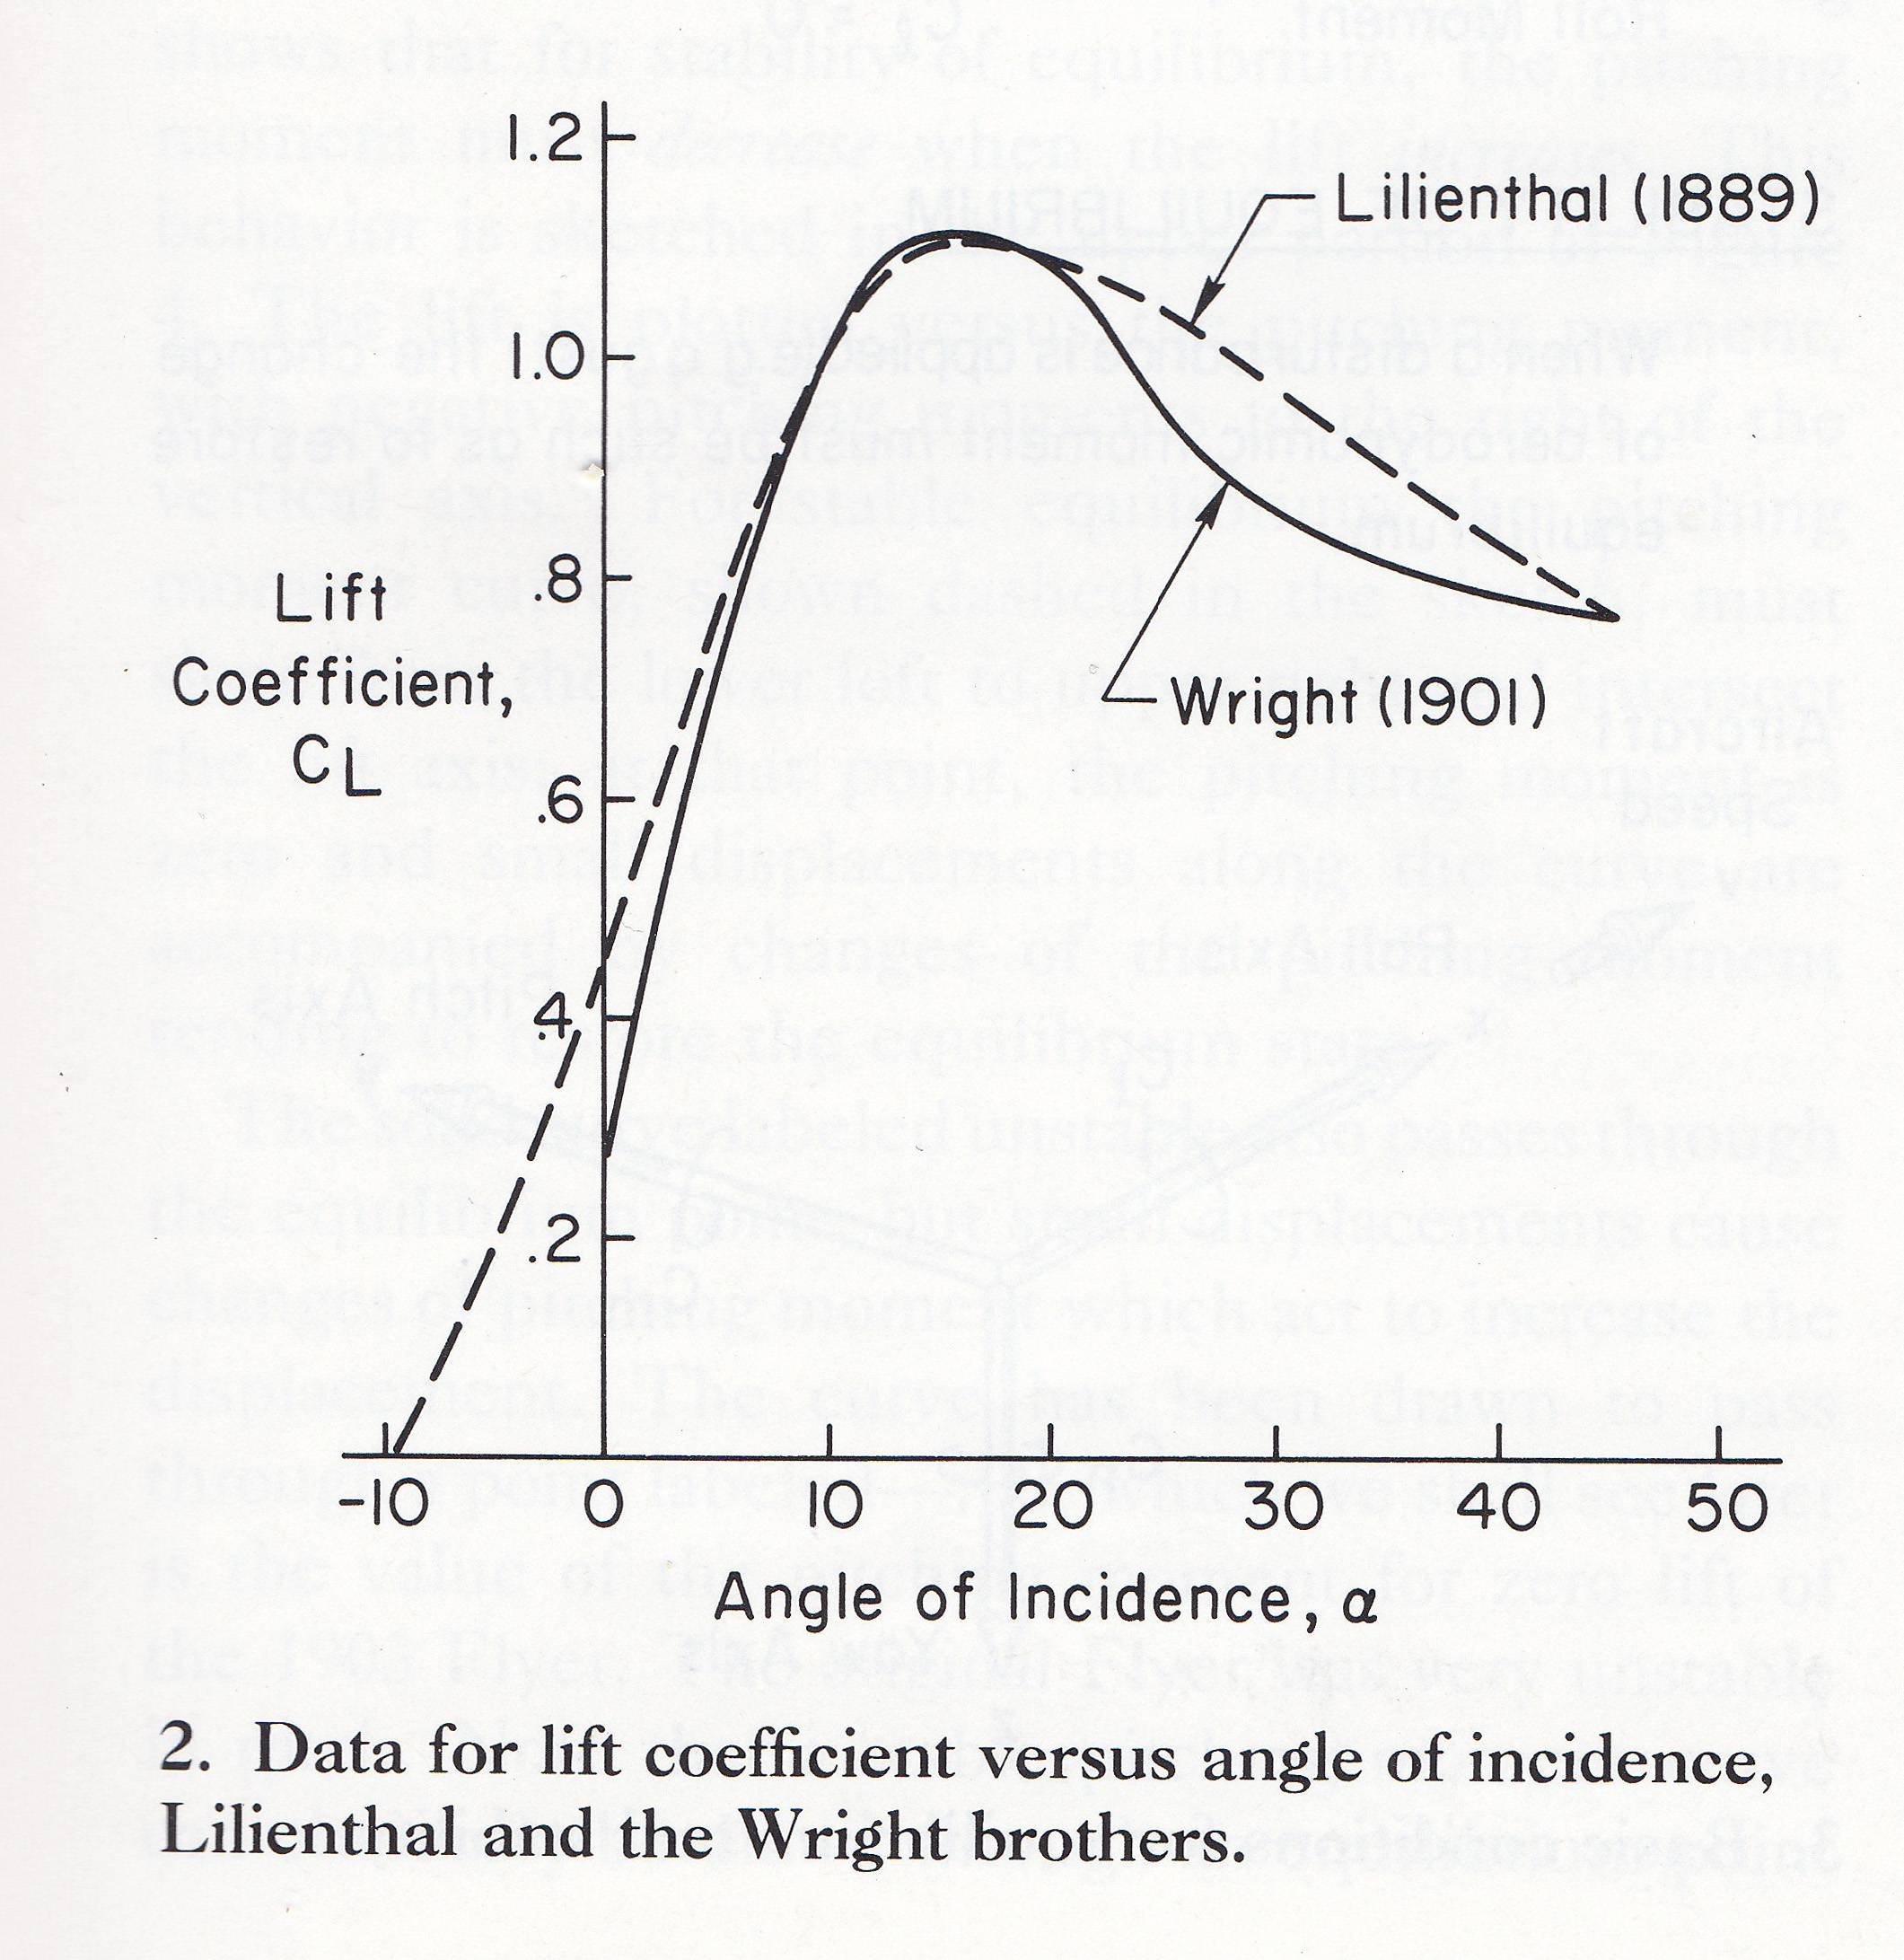
Data for lift coefficient versus angle of incidence, Lilienthal and the Wright Brothers, Wolko, p. 21, figure 2
Compare this to the CL curves on two types of modern aircraft and you can see that Lilienthal and the Wrights did pretty well.
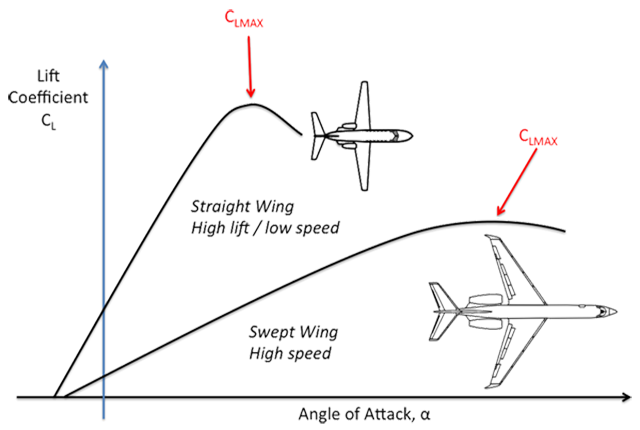
Wing sweep effects on lift curves
7
The generation of lift
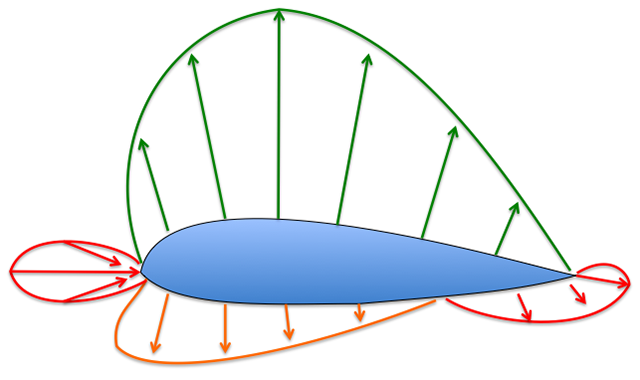
Air foil pressures
The generation of lift by an airfoil is dependent upon the airfoil being able to create circulation in the airstream and develop the lifting pressure distribution on the surface. In all cases, the generated lift will be the net force caused by the distribution of pressure over the upper and lower surfaces of the airfoil. At low angles of attack, suction pressures usually will exist on both upper and lower surfaces but the upper surface suction must be greater for positive lift. At high angles of attack near that for maximum lift, a positive pressure will exist on the lower surface but this will account for approximately one-third of the net lift.
Source: Hurt, pg. 20
The basic lift equation
Lift has been defined as the net force developed perpendicular to the relative wind. The aerodynamic force of lift on an airplane results from the generation of a pressure distribution on the wing. This lift force is described by the following equation:
where
| L | = | lift |
| CL | = | lift coefficient |
| q | = | dynamic pressure |
| = | ½ ρ V2 | |
| S | = | wing surface area |
Source: Hurt, pg. 23
Airfoil Lift Characteristics
Airfoil section properties differ from wing or airplane properties because of the effect of the planform. Actually the wing may have various airfoil sections from root to tip with taper, twist, sweep back and local flow components in a span wise direction. The resulting aerodynamic properties of the wing are determined by the action of each section along the span and the three-dimensional flow and the force coefficients are given a notation of lower case letters. For example, a wing or airplane lift coefficient is CL while an airfoil section lift coefficient is termed cl.
Source: Hurt, pg. 27
I think many aero texts get sloppy in this regard, many switching between section and whole wing equations with little or no notice. I think we can simplify things, for a pilot's perspective, if we call CL the coefficient of lift for the entire wing, which allows us to remove the "S" from the L = CL q S equation. We can also substitute ½ ρ V2 for q and end up with the equation we learned in basic aero:
Lift Equation
Do you need to know this equation to fly an airplane? No, of course not. But it does teach the relative importance of the variables. You can control the CL with leading and trailing edge devices, flaps and slats. You can control the ρ only indirectly by virtue of the altitude and temperature. Finally, you can control the V and its impact is magnified by the 2.
References
(Source material)
Dole, Charles E., Flight Theory and Aerodynamics, 1981, John Wiley & Sons, Inc, New York, NY, 1981.
Hurt, H. H., Jr., Aerodynamics for Naval Aviators, Skyhorse Publishing, Inc., New York NY, 2012.
Wolko, Howard S., The Wright Flyer: An Engineering Perspective, National Air and Space Museum, 1987