When I started flying in 1979, getting weather in the Air Force meant calling the weather shop via UHF or getting a phone patch via HF. We could also take advantage of the civilian system by calling up the nearest Flight Service Station and have the weather described to us. These days, we have better products available to us with an Internet connection. The challenge is knowing where to look.
— James Albright

Updated:
2023-03-15
Hawaii weather
Click photo for video
Over the last ten years I lamented the fact I got better weather on my smart-phone than I did on my smart airplane. But now with high-speed Internet in the cockpit, we got it all. Here are some online sources to choose from.
And for more online resources:

1
Preflight briefing
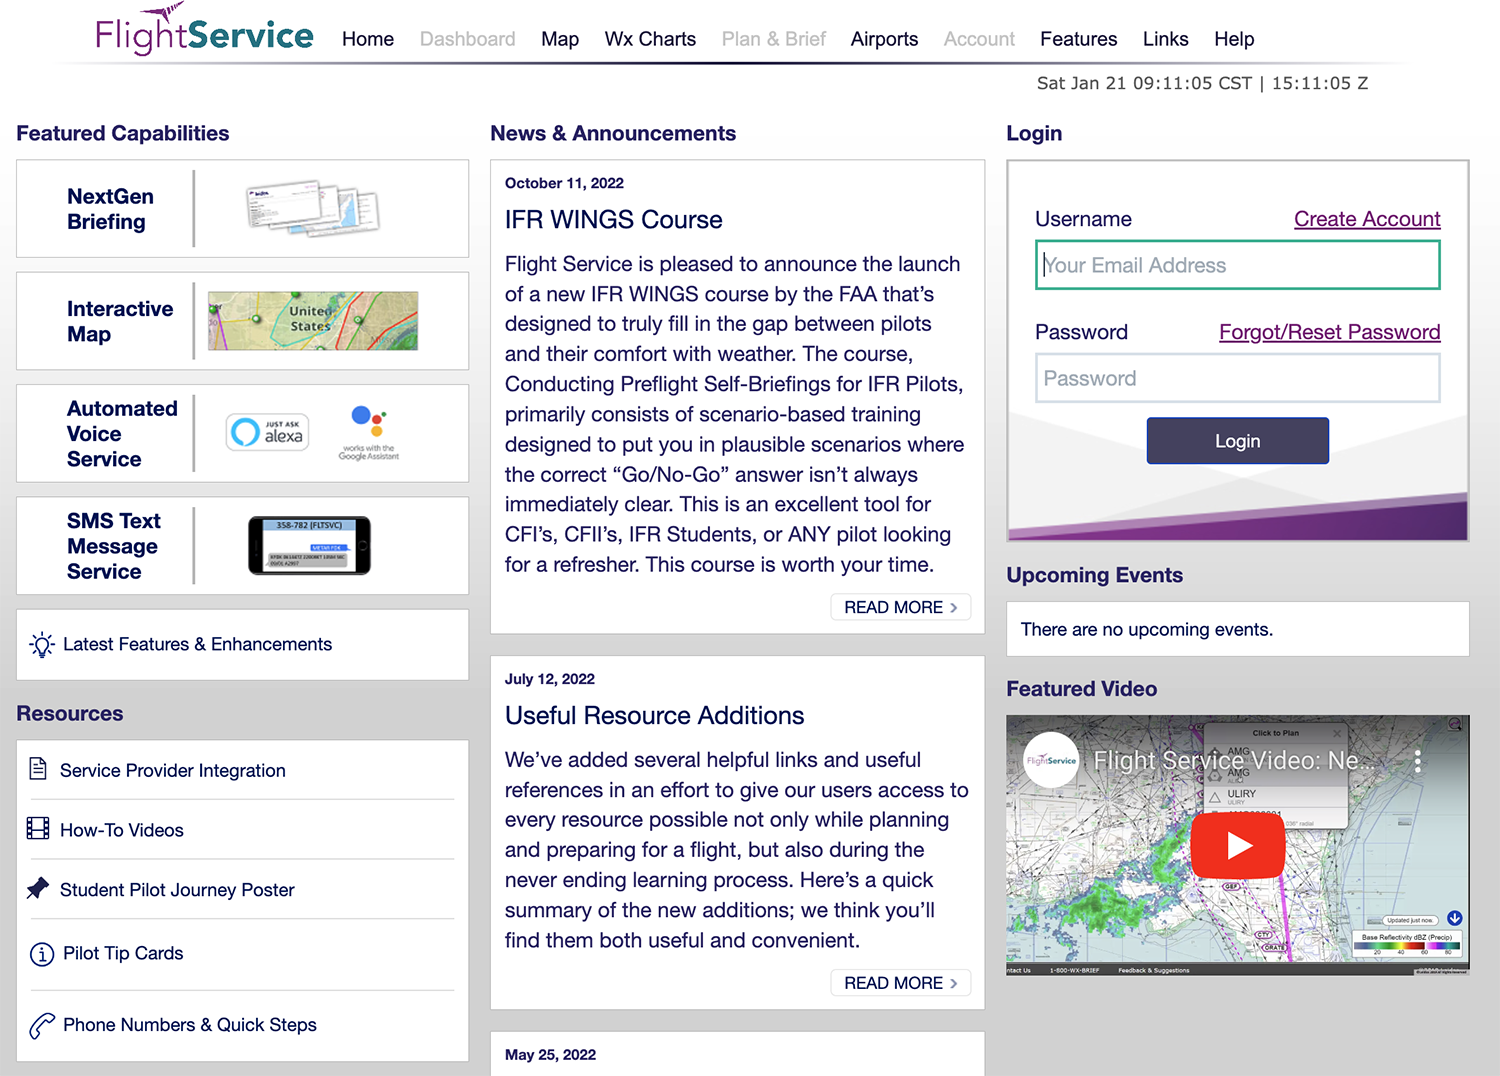
Flight Service (1-800-WX-BRIEF)
Many of us started our aviation lives with a morning call to the local flight service station for everything from finding out where to fly to actually filing our flight plans. That system still exists with a phone call, but it is even better on line.
Link: https://www.1800wxbrief.com/
https://www.1800wxbrief.com/
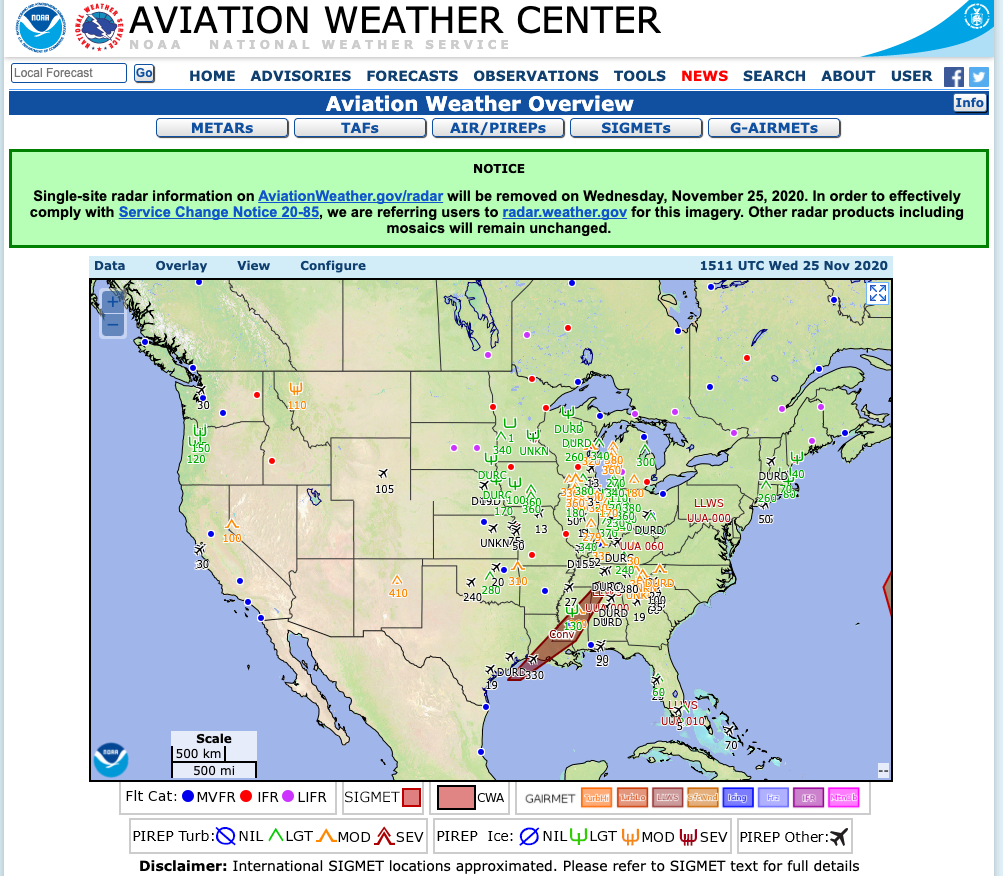
U.S. Aviation Weather Center
For weather over the Continental United States, it is hard to beat this NOAA site. It used to be a one-stop-shop for all things weather in the CONUS. You will not only get METARs, TAFs, AIR/PIREPs, SIGMETs, and G-AIRMETs, you will find lots of interactive maps.
Link: https://www.aviationweather.gov/
https://www.aviationweather.gov/
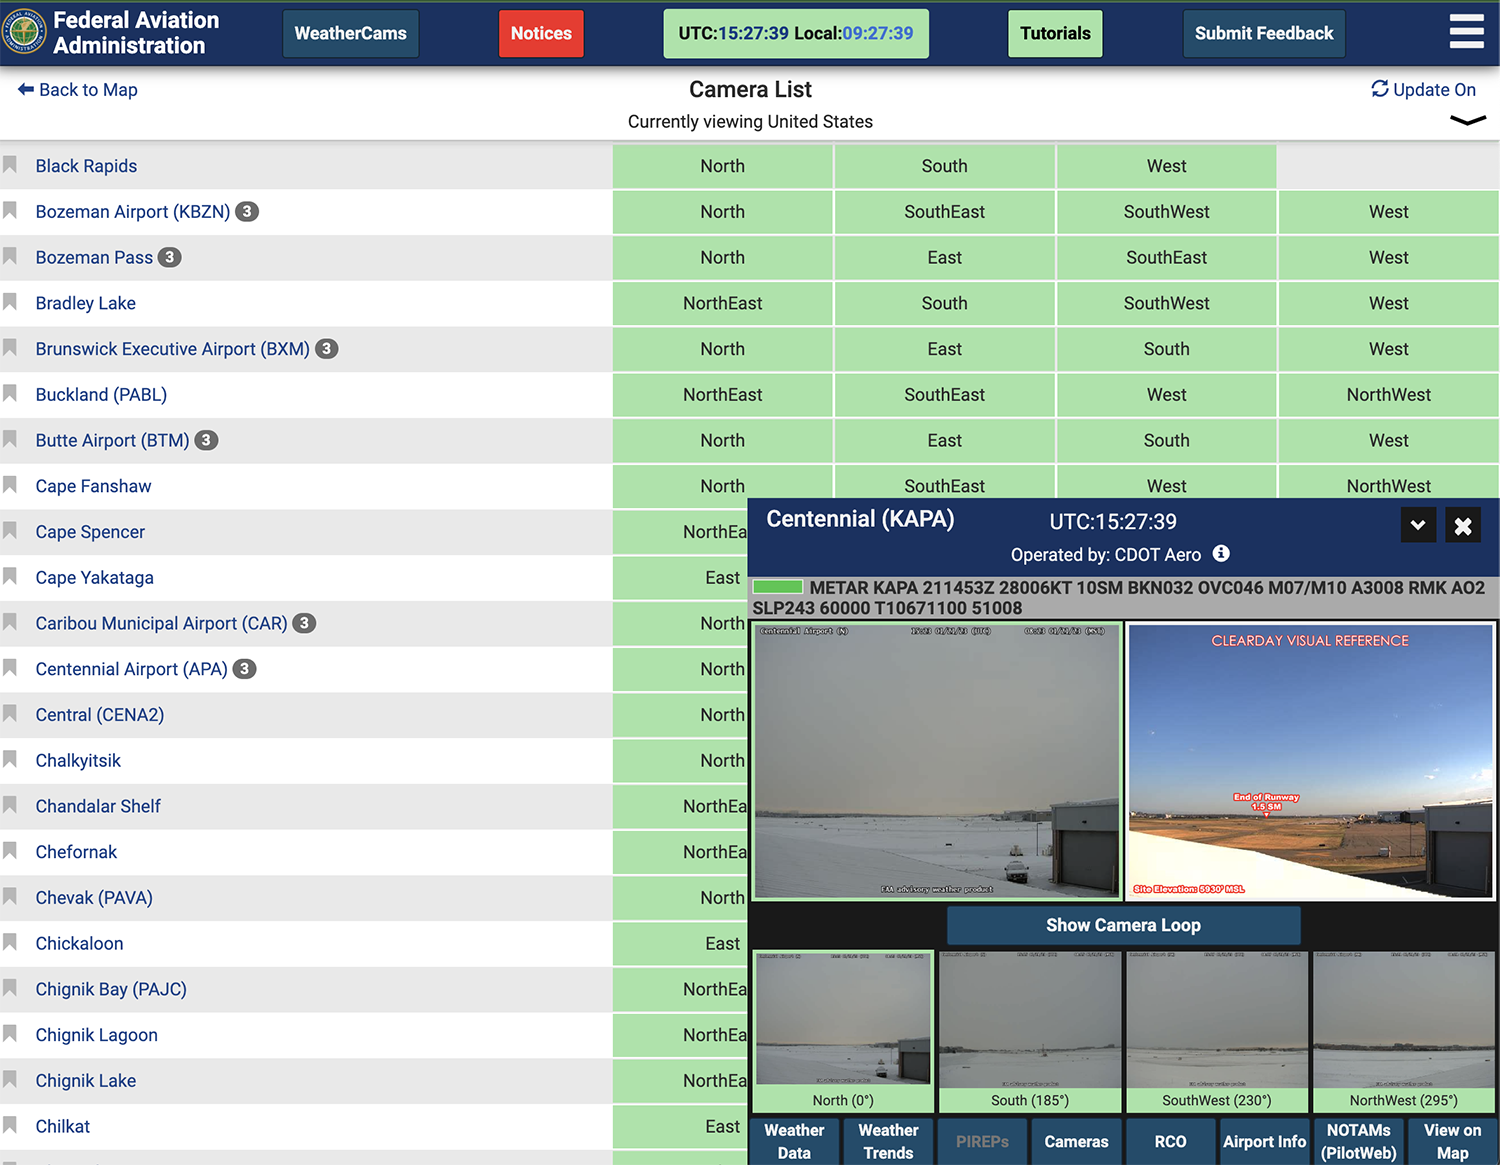
U.S. Weather Cameras
Sometimes a picture is worth a thousand forecasts and it would be nice to get a live video feed from your destination. The good news is you can do that for quite a few airports and there is a website that consolidates many of these. The bad news is that not all airports have video feeds and site navigation isn't that easy. To see the cameras, click the menu icon on the top right and select "Camera List."
Link: https://weathercams.faa.gov/
https://weathercams.faa.gov/
2
Inflight updates
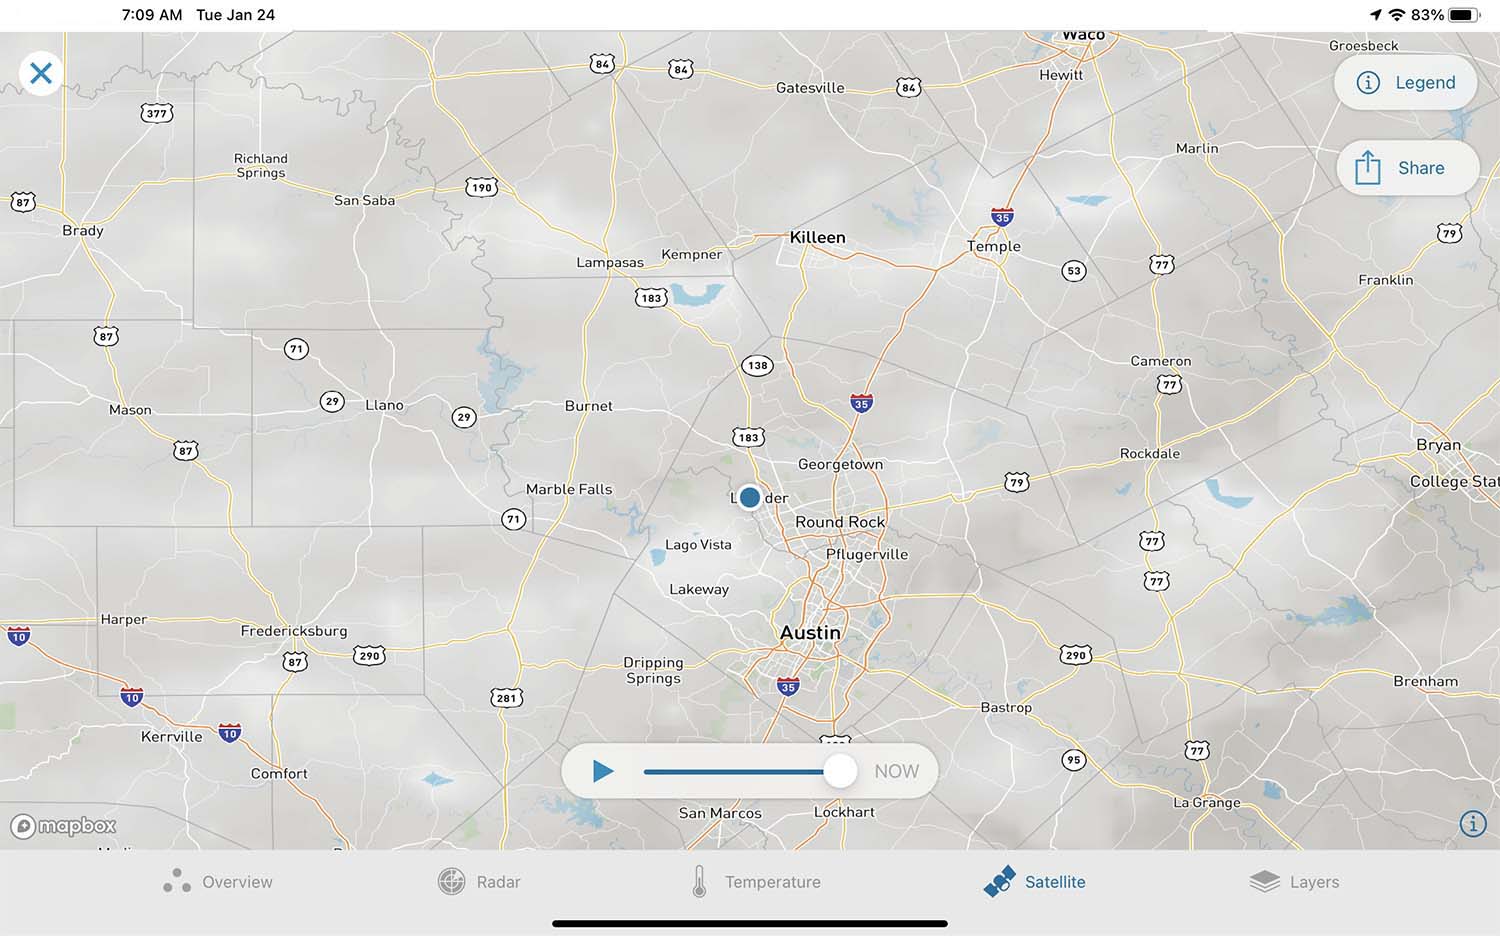
ForeFlight
My first choice for inflight weather information is ForeFlight because it has just about everything I need en route, is easy to use, and integrates well with a portable ADS-B receiver.
Link: https://foreflight.com/
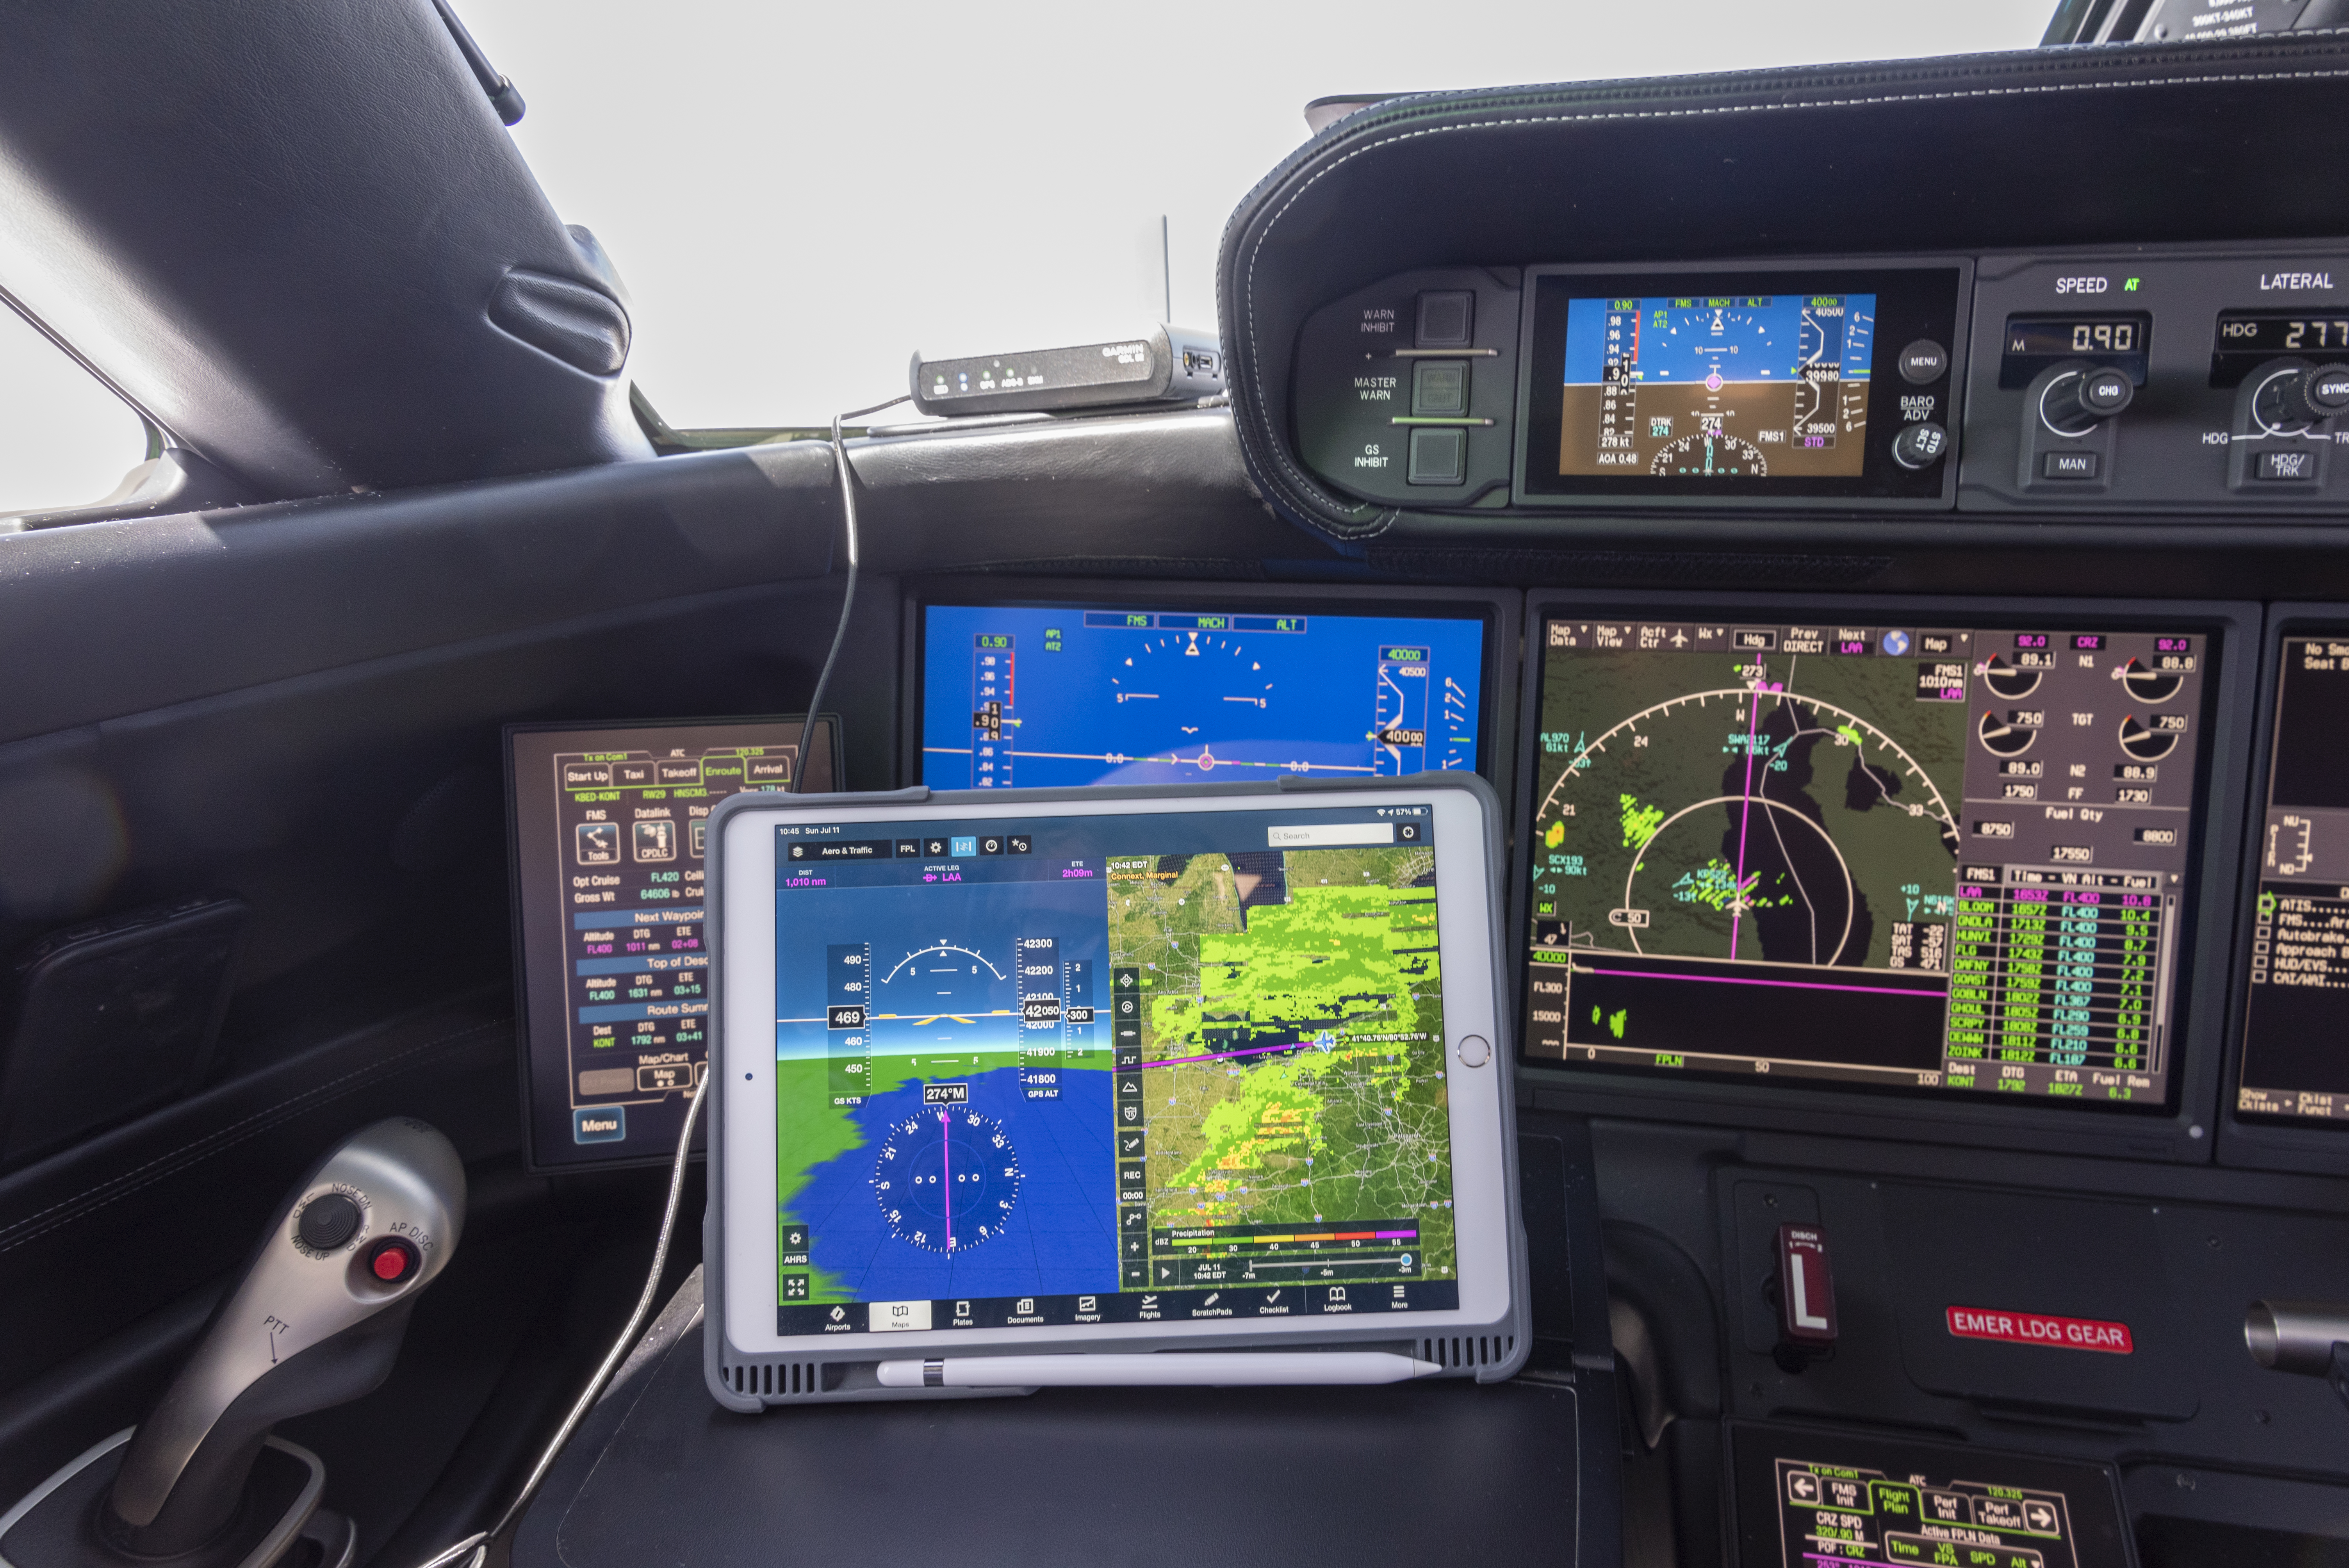
Even with all the weather we have available in the cockpit, the added ForeFlight information always provides something extra.
Flight Information Service - Broadcast (FIS-B)
FIS-B over Universal Access Transceiver (UAT) datalink service provides aeronautical information and meteorological information to the flight deck for aircraft operating in the NAS. These products are broadcast over the Automatic Dependent Surveillance-Broadcast (ADS-B) UAT link so that pilots have timely information of regional weather and NAS status/changes that might affect flight. FIS-B aeronautical information and meteorological information products provide strategic information to the flight deck that enhances a preflight briefing. FIS-B products do not include all NOTAMs.
Source: Aviation Weather Handbook, ¶3.3.4.1
Your experience with FIS-B depends on your avionics and what the manufacturer decides to present, so you really need to dive into your manuals to find out.
Apps
There are a lot of weather Apps out there for pilots and it may be hard to discern the good from the bad. Here are a few favorites, all available at your App Store.
AeroWeather Pro
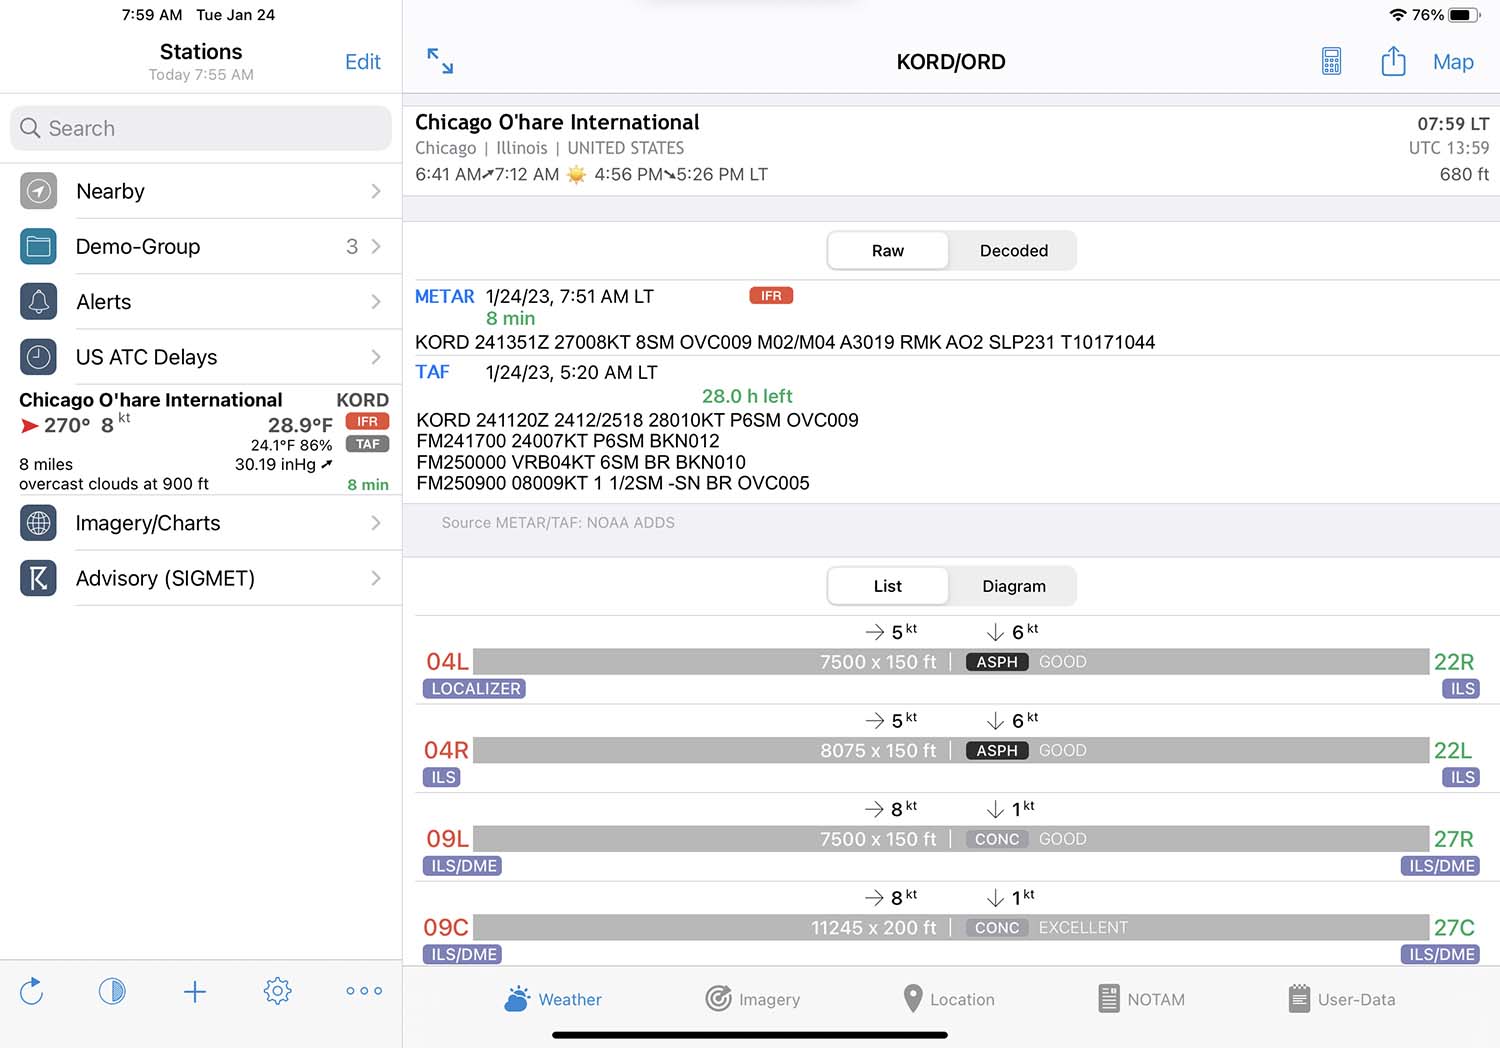
A very good free App for airport weather, and a lot of other pilot-related weather information for an extra fee, $4.99/year.
AWeather - Avantis Weather. This App is free.
Storm Radar: Weather Tracker
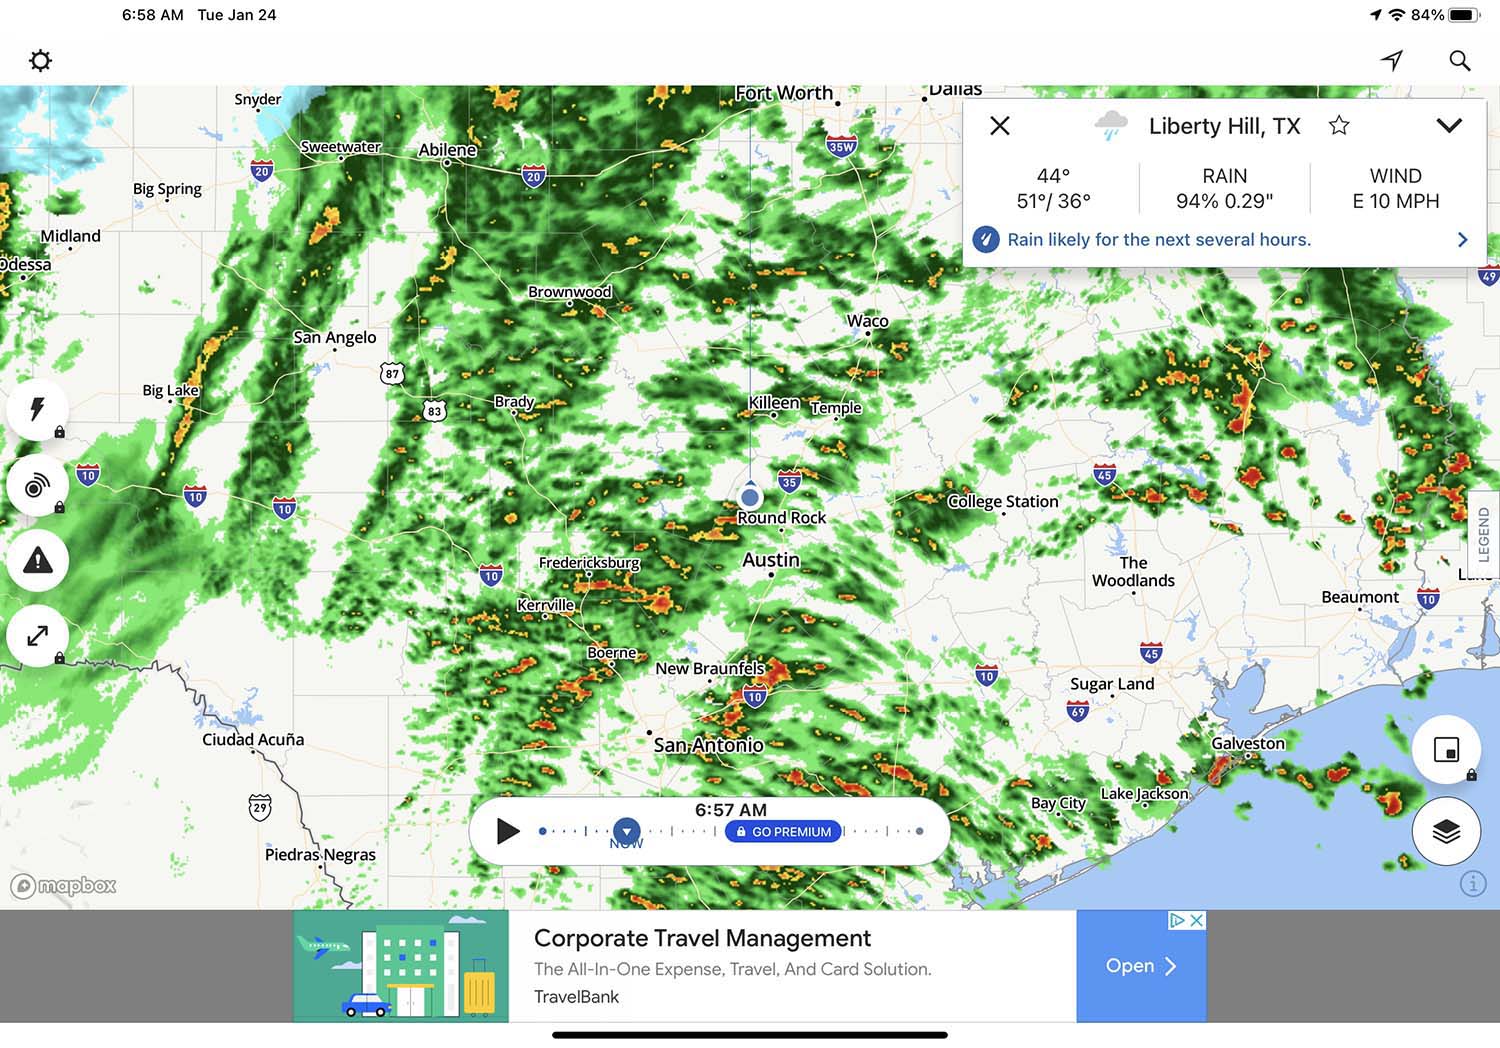
This is a good App for following the weather from home, though I suppose it does provide additional situational awareness from flight too. This App is free.
Turbulence Forecast
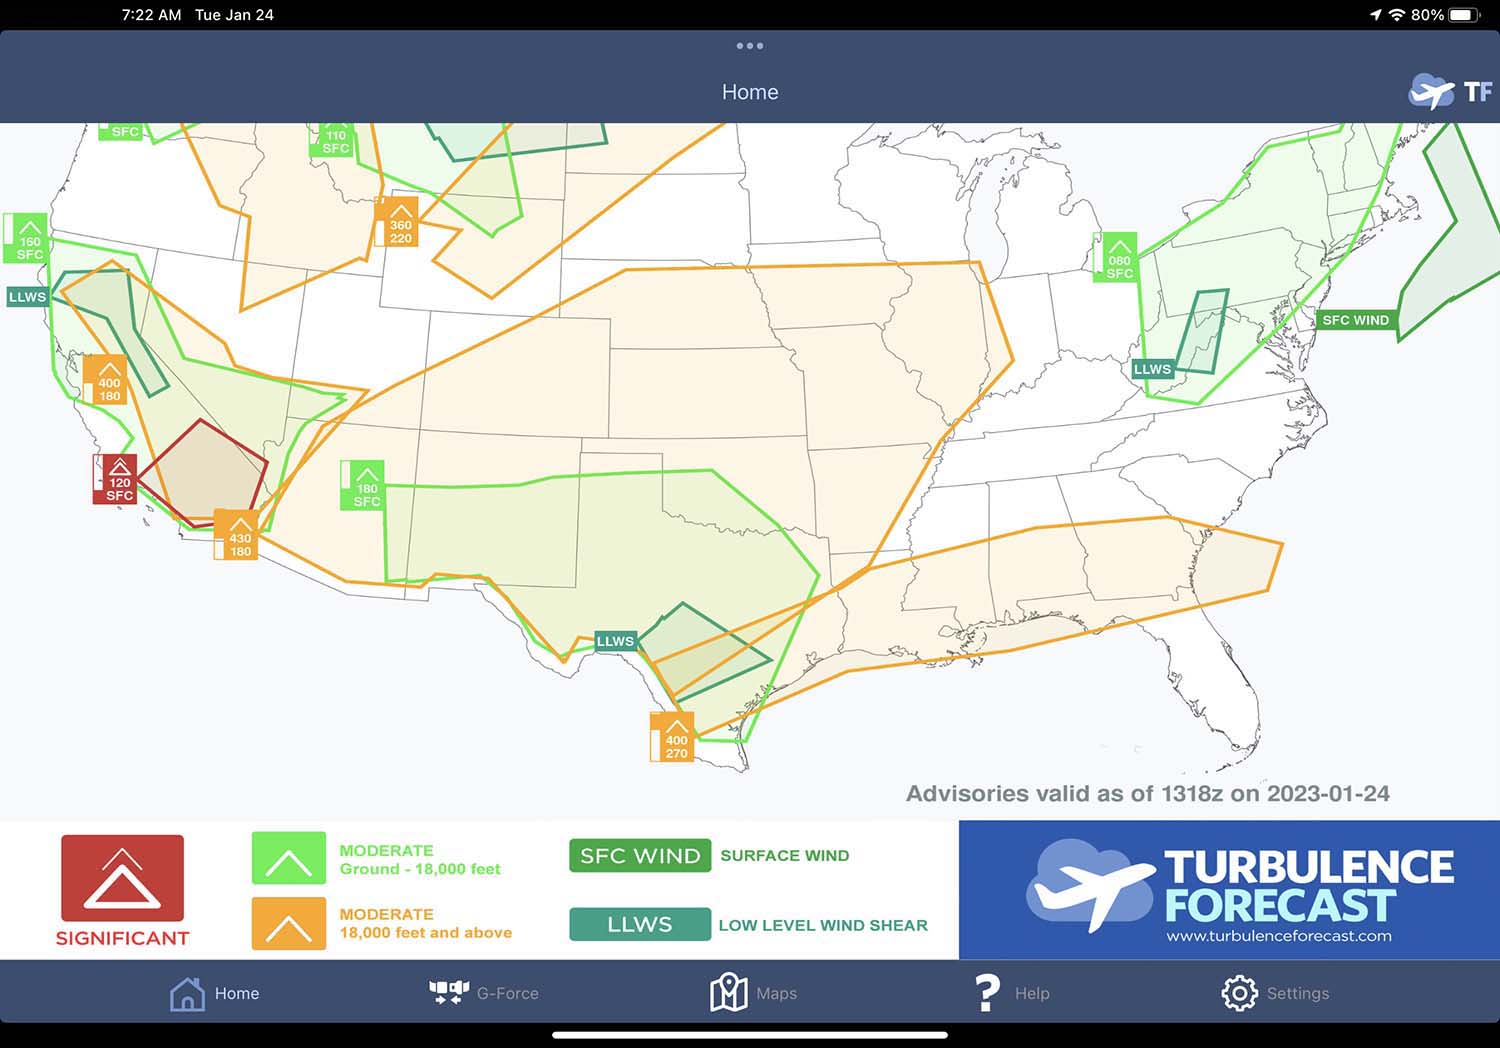
Turbulence Forecast offers information you can get elsewhere, but if your specific question is about turbulence, it provides you what you need with a minimum of fuss. This App is free.
WeatherMap+
This is a good choice for international flying. Cost: $2.99.
Weather Underground
This App provides the basics and is my "go to" away from the cockpit. It is free, but there are streaming advertisements.
3
Hurricanes, tropical cyclones
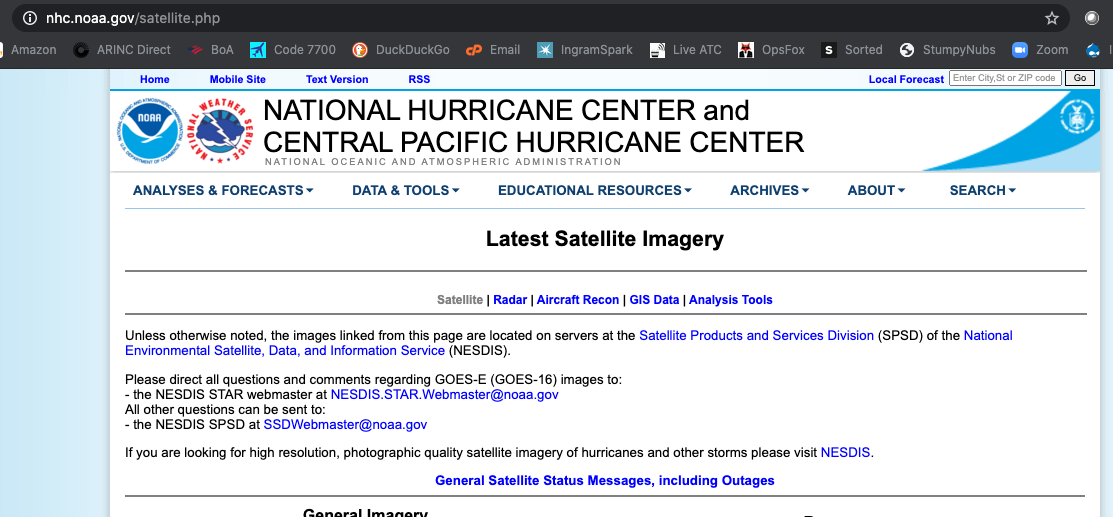
National and Central Pacific Hurricane Center
The National Hurricane Center and Central Pacific Hurricane Center website is hosted by the National Oceanic and Atmospheric Administration and offers satellite imagery of the Atlantic and Pacific. The loops are especially useful for getting a sense of how the weather is moving.
Link: https://www.nhc.noaa.gov/satellite.php
nhc.noaa.gov
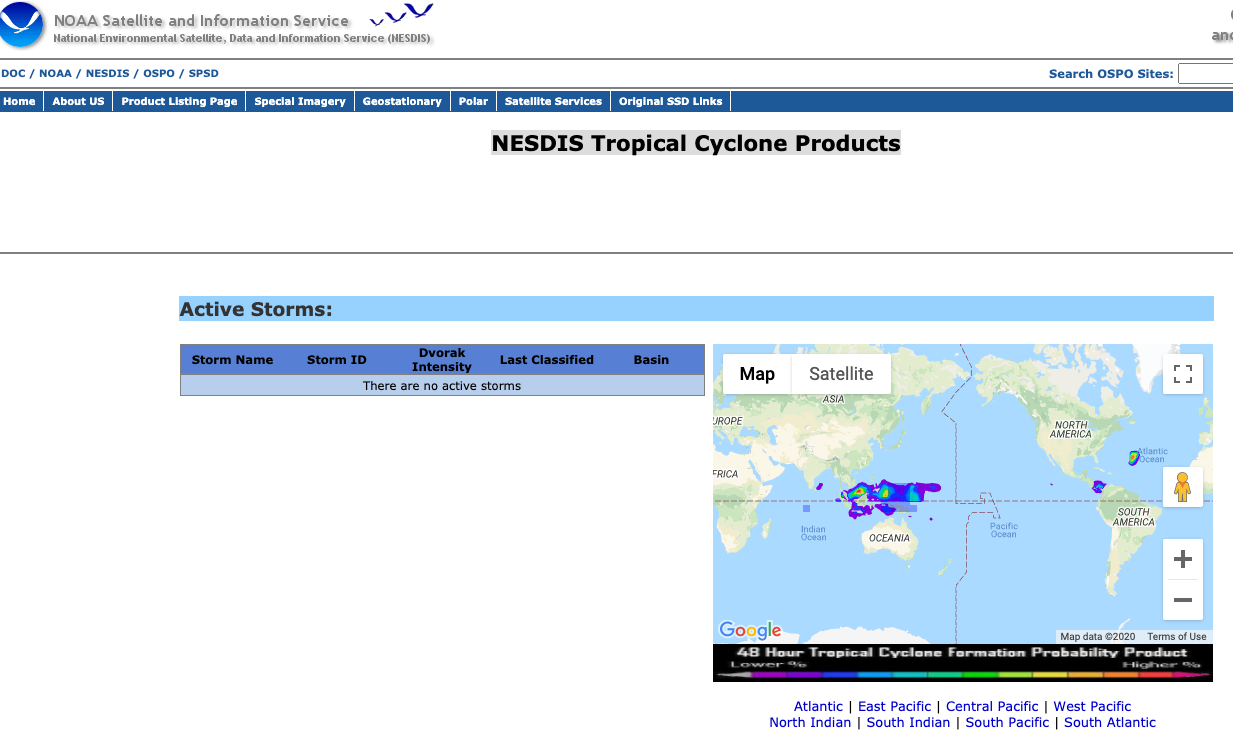
NESDIS Tropical Cyclone Products
The National Environmental Satellite, Data and Information Service (NESDIS) issues tropical cyclone imagery that can be critical to those flying in the Pacific and Indian Oceans.
Link: https://www.ospo.noaa.gov/Products/ocean/tropical/
https://www.ospo.noaa.gov/Products/ocean/tropical/
4
International Products
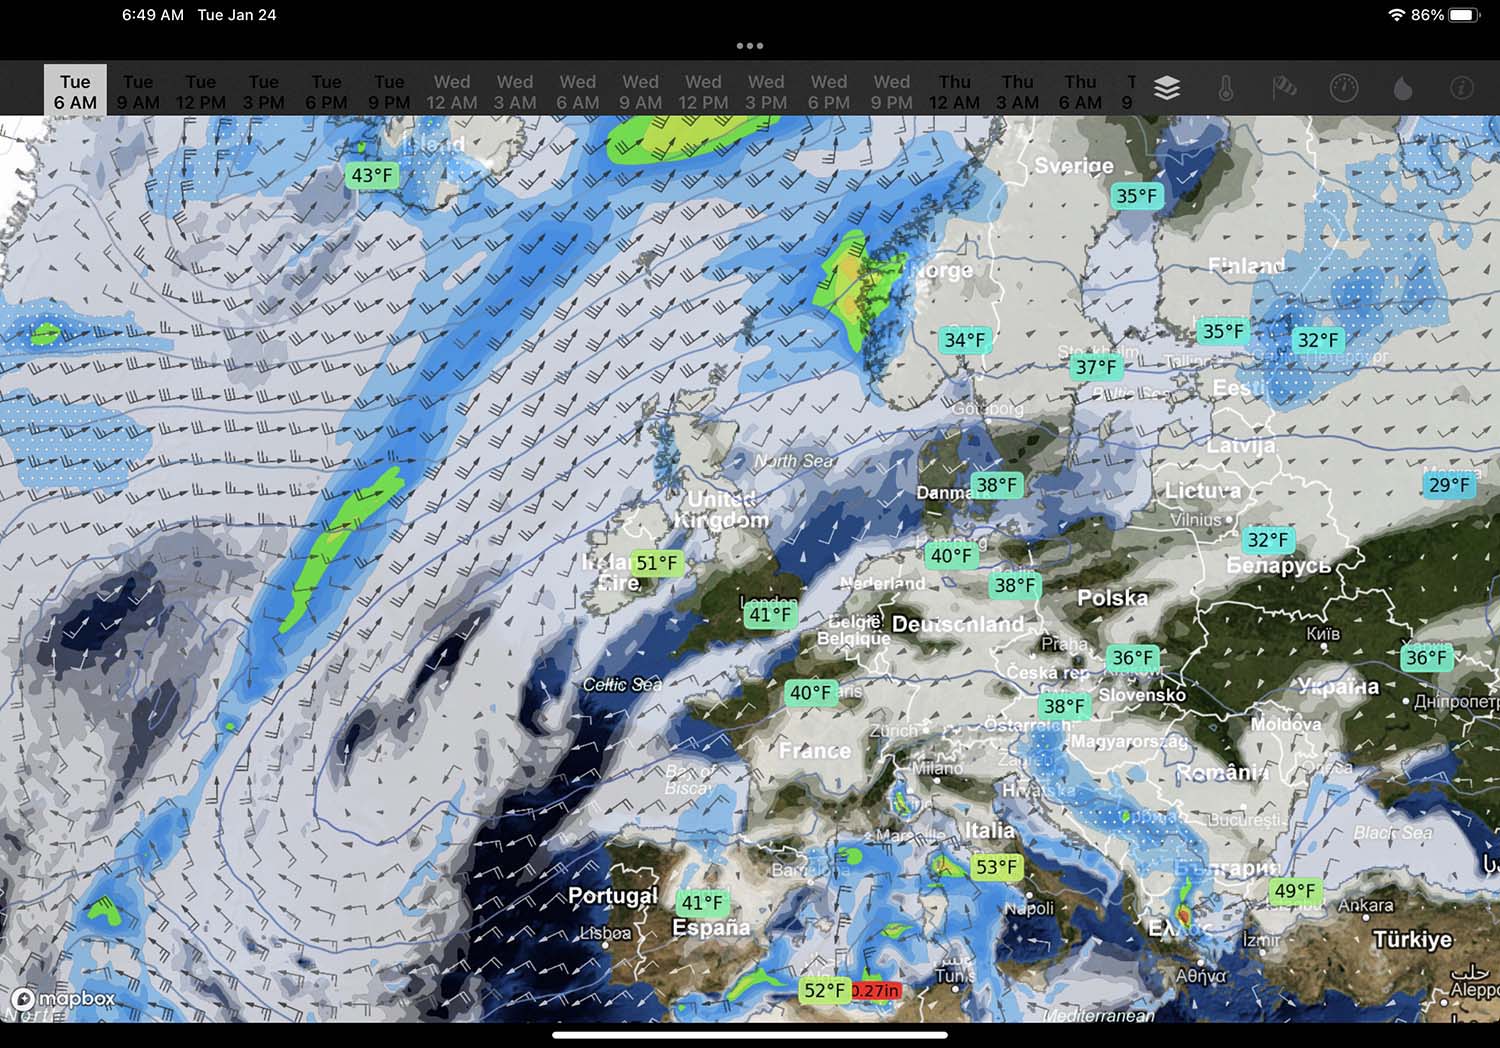
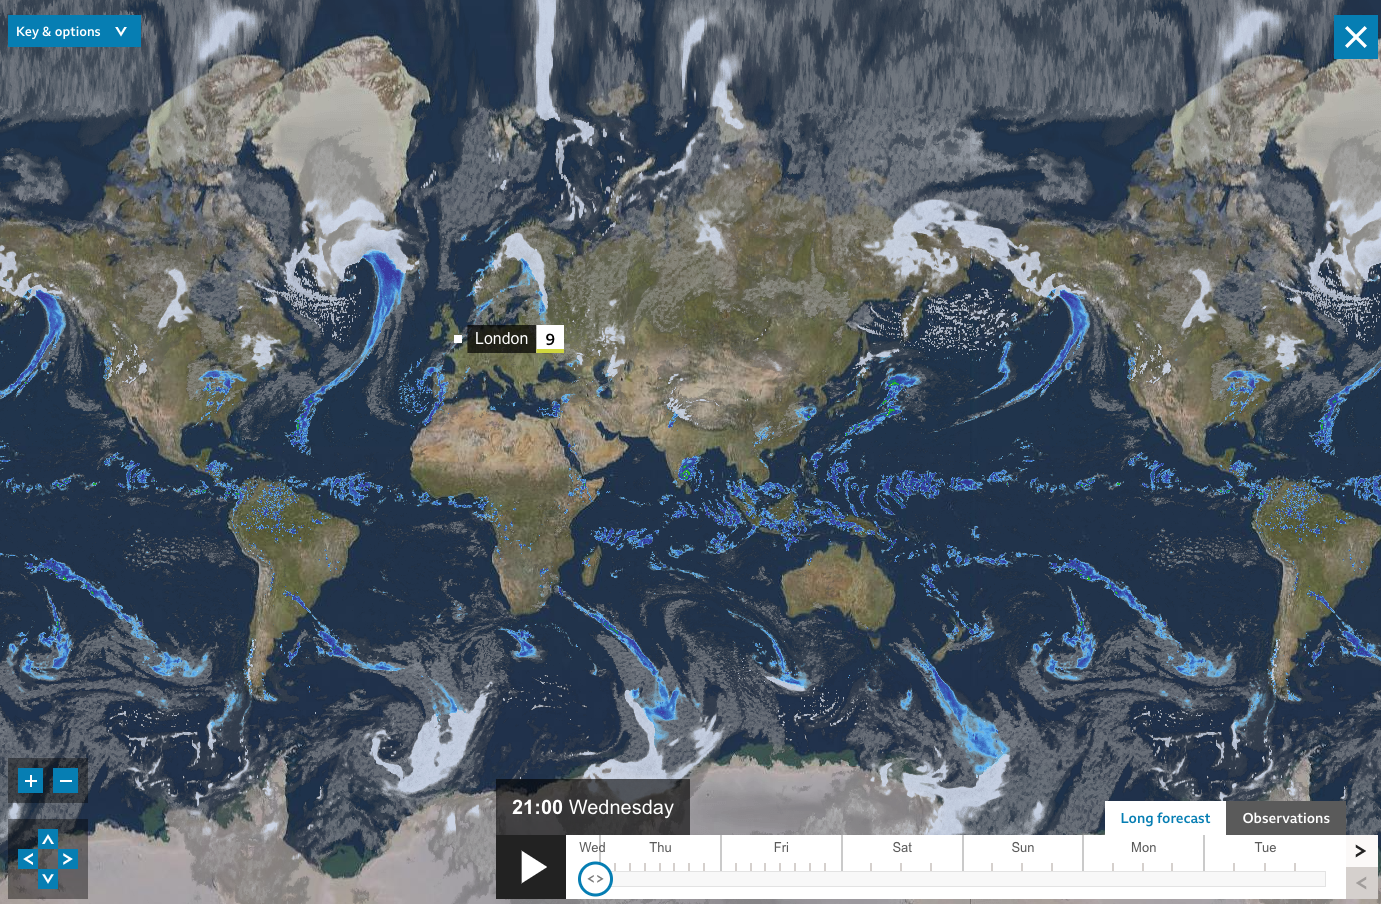
BBC weather map
The beauty of this product is that it gives you a visual forecast of weather systems in the future.
Link: https://www.bbc.com/weather/map
www.bbc.com/weather/map
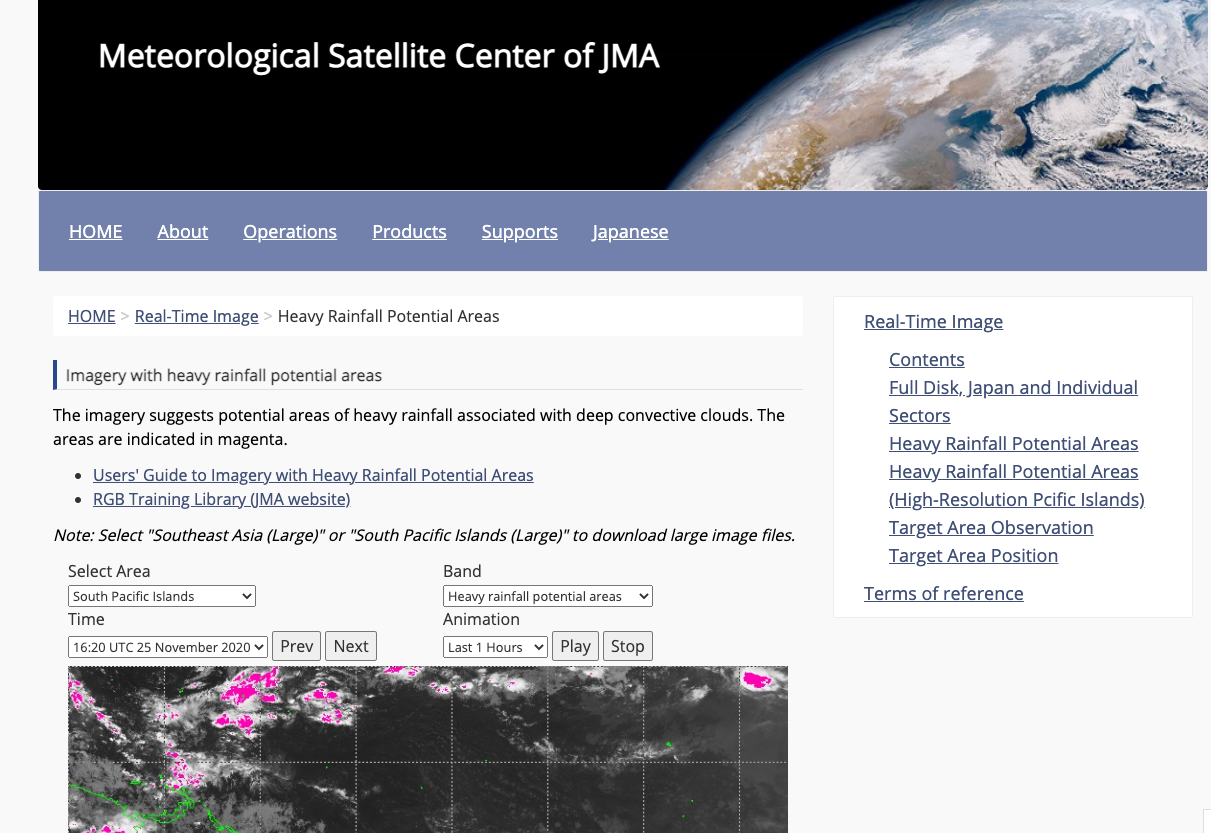
Japan's Meteorological Satellite Center
The Japanese have their own satellite dedicated to complete views of the Japanese islands.
Link: https://www.data.jma.go.jp/mscweb/data/himawari/sat_hrp.php?area=r5s
www.data.jma.go.js
5
Satellite imagery
Geostationary Operational Environmental Satellite (GOES)
The NOAA's GOES satellite senses electromagnetic energy at five wavelengths. Of greatest use to us as pilots are the infrared and visible imagery.
Link: https://www.goes.noaa.gov/index.html
www.goes.noaa.gov/index.html
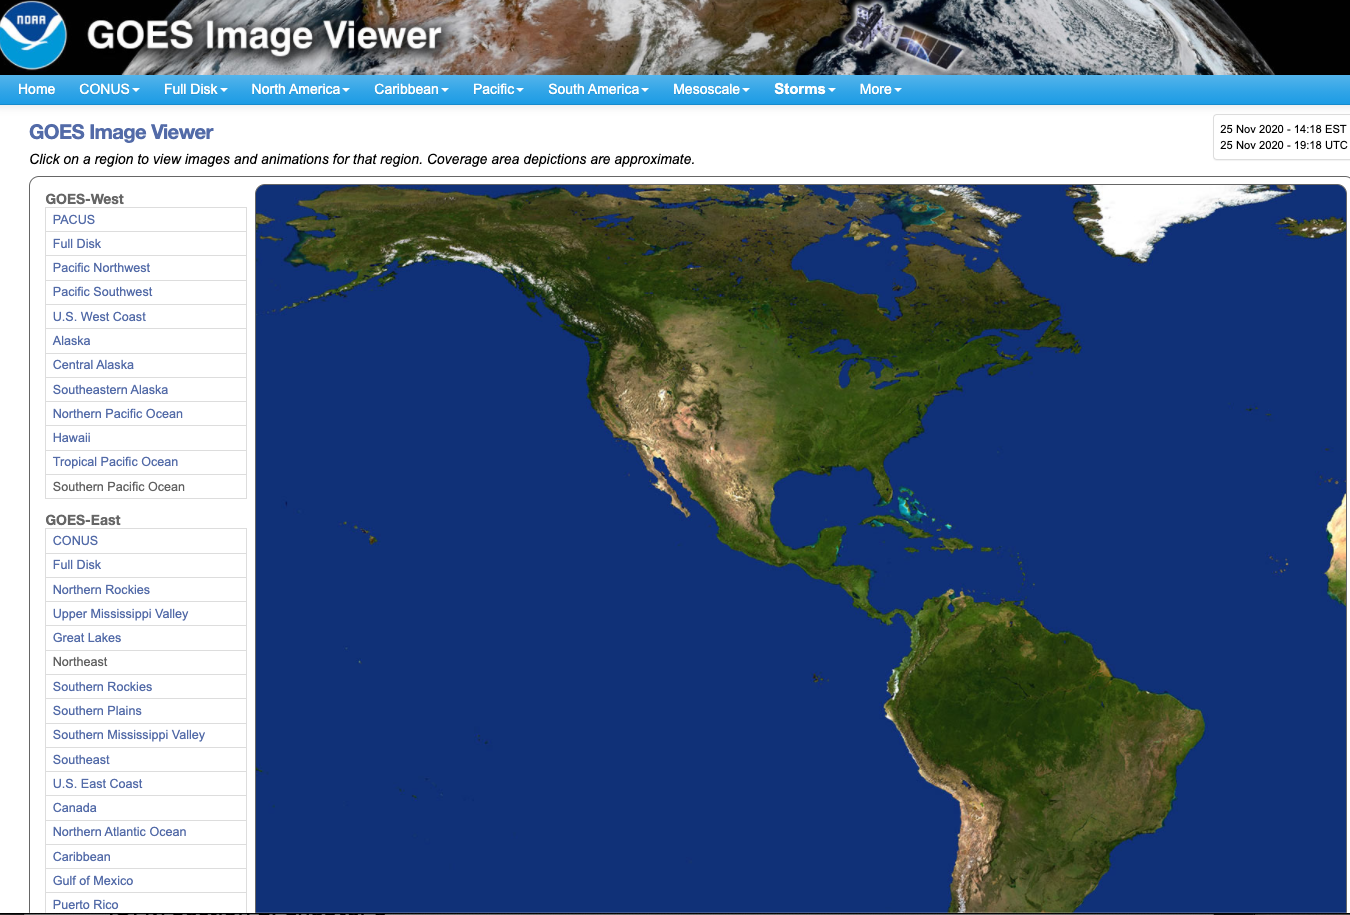
GOES image viewer
This is an interactive view of the Western Hemisphere with all sorts of imagery available. The Geo-Color Animated Loop or Animated GIF selections provide great detail but are data-intensive (on the order of 12 MB) so you might want to view these before flight.
Link: https://www.star.nesdis.noaa.gov/GOES/index.php
www.star.nesdis.noaa.gov/GOES/
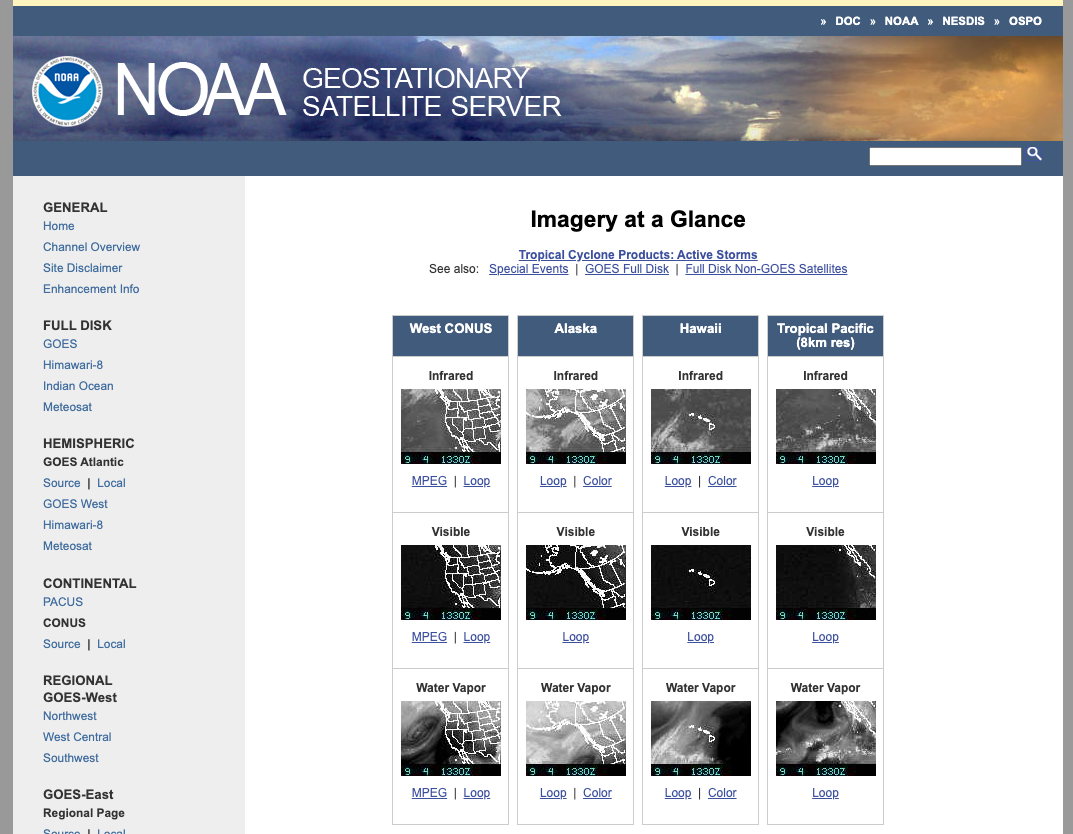
NOAA Geostationary Satellite Server
Sometimes you just want the big picture. These geostationary satellites are parked over their parts of the world to provide just that.
Link: www.goes.noaa.gov/index.html#OTHFD
www.goes.noaa.gov
6
Space weather
Solar flare, Wikimedia Commons
In the past, "space weather" was only a concern for those of us relying on High Frequency radio communications. These days, anyone relying on GPS needs to be concerned with space weather, which means all of us. The best source of space weather information comes from the NOAA and the Space Weather Prediction Center. The forecasts are available in the "Products and Data" tab.
I think the best predictor of solar activity may be the "Kp-Index" which you can find in those forecast products. On most days we see numbers around 3. Numbers above 5 can mean HF difficulties. A Kp of 9 is as bad as it gets, but it really depends on where the solar flare is headed.
Kp 0 – Quiet – Aurora oval mostly to the north of Iceland. Faint aurorae visible in photographs, low in the northern sky
Kp 1 – Quiet – Aurora oval over Iceland, faint and quiet aurorae visible to the unaided eye low in the northern sky
Kp 2 – Quiet – Auroras readily visible and become brighter and more dynamic
Kp 3 – Unsettled – Bright auroras visible at zenith. Pale green colour more obvious
Kp 4 – Active – Bright, constant and dynamic northern lights visible. More colours start to appear
Kp 5 – Minor storm – Bright, constant and colourful aurora display, red and purple colours appear. Aurora coronae likely
Kp 6 – Moderate storm – Bright, dynamic and colourful aurora display. Aurora coronae likely. Memorable to those who witness them
Kp 7 – Strong storm – Bright, dynamic and colourful aurorae. Visible in the southern sky. Aurora coronae very likely
Kp 8 – Severe storm – Bright, dynamic and colourful aurorae. Aurora seen around 50° latitude
Kp 9 – Intense storm – Aurorae seen around 40° latitude. Red aurorae and coronae very likely. Most often caused by powerful coronal mass ejections
Source: Aurora Forecast
Coronal mass ejections

Coronal mass ejection, Photo: Color4260 at Shutterstock
Coronal Mass Ejections (CMEs) are large expulsions of plasma and magnetic field from the Sun’s corona. They can eject billions of tons of coronal material and carry an embedded magnetic field (frozen in flux) that is stronger than the background solar wind interplanetary magnetic field (IMF) strength. CMEs travel outward from the Sun at speeds ranging from slower than 250 kilometers per second (km/s) to as fast as near 3000 km/s. The fastest Earth-directed CMEs can reach our planet in as little as 15-18 hours. Slower CMEs can take several days to arrive. They expand in size as they propagate away from the Sun and larger CMEs can reach a size comprising nearly a quarter of the space between Earth and the Sun by the time it reaches our planet.
Source: SPWC.NOAA.GOV
This may sound like science fiction, but if a coronal mass ejection were to hit the earth, not only could GPS be completely disrupted, but all electrical systems could be severely impacted. The largest recorded instance of this happening was in 1859 and is known as the Carrington Event. It is interesting reading: Wikipedia / Carrington Event. Back then it impacted telegraph wires. These days the impact could be catastrophic.
I mention all this so that if we were to expect something more than a glancing blow from a coronal mass ejection and the world's airspace system is shut down, you will know why. How much warning?
Imminent CME arrival is first observed by the Deep Space Climate Observatory (DSCOVR) satellite, located at the L1 orbital area. Sudden increases in density, total interplanetary magnetic field (IMF) strength, and solar wind speed at the DSCOVR spacecraft indicate arrival of the CME-associated interplanetary shock ahead of the magnetic cloud. This can often provide 15 to 60 minutes advanced warning of shock arrival at Earth – and any possible sudden impulse or sudden storm commencement; as registered by Earth-based magnetometers.
Source: https://www.swpc.noaa.gov/phenomena/coronal-mass-ejections
7
Volcanic ash
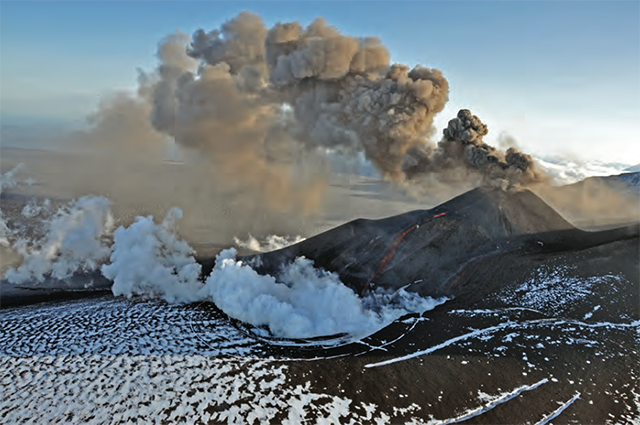
Alaska volcano, from Alaska Volcano Plan
Volcanic ash information is given in METARs, PIREPs, AIREPs, SIGMETs, VAA, and CWA. Forecasts are given in TAFs, Alaska Area Forecasts, Hawaii Area Forecasts, Gulf of Mexico and Caribbean Area Forecasts, SIGWX. One of the best online sources is from the NOAA: NOAA Volcanic Ash Products.
For more about this: Volcanic Ash.
8
Weather radar
U.S. Radar Weather
Imagine being able to stitch together every FAA, NWS, and DoD weather radar site so you had access to it all? Well, here it is.
Link: https://radar.weather.gov/
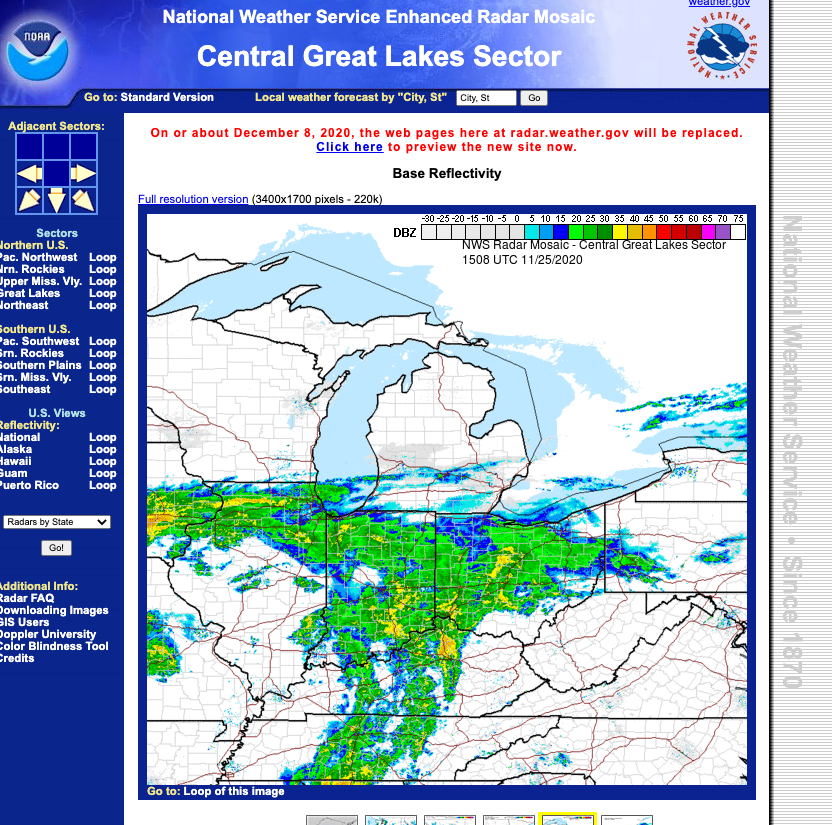
https://radar.weather.gov/
References
(Source material)
Aviation Weather Handbook, FAA-H-8083-28, U.S. Department of Transportation, 2022.