The operating flight strength of an airplane is presented in the form of V-g or V-n diagrams, where the "V" denotes airspeed and the "g" or the "n" denotes load factor. You might find a V-g diagram in your flight manual if you are flying a high performance fighter. The V-g diagram leads you to cornering speed and that allows you to extract maximum performance from your aircraft without breaking it.
— James Albright
Updated:
2015-02-15
A surprising amount of the science of maneuvering flight still applies to us in corporate and airline aviation. Using a V-g diagram, for example, tells me a G450 cannot really pull 2 G's at most landing weights on approach, it will stall first. While my earliest Air Force text says "The chart usually is included in the aircraft flight handbook in the section dealing with operating limitations," I've never seen a V-g diagram published in any airplane without an ejection seat. Of course if you fly your airplane with a minimum level of finesse you may never need such a chart. But if you would like a chart, you have what you need to build one. I will show you how.
Whether or not your aircraft has a V-g diagram or you build your own, you must still understand that VA maneuvering speed is not what you've been taught. See: VA - Maneuvering Speed for more about this.

1
V-g diagrams, theory
Load factor in many classic texts is labeled "n" but have become "G" in keeping with pilot phraseology.
ATCM 51-3, figure 5.3
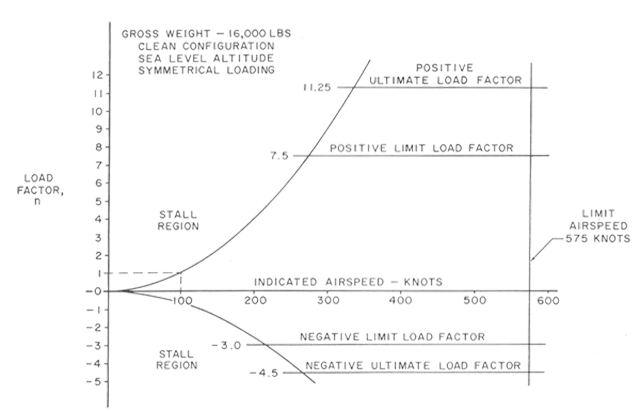
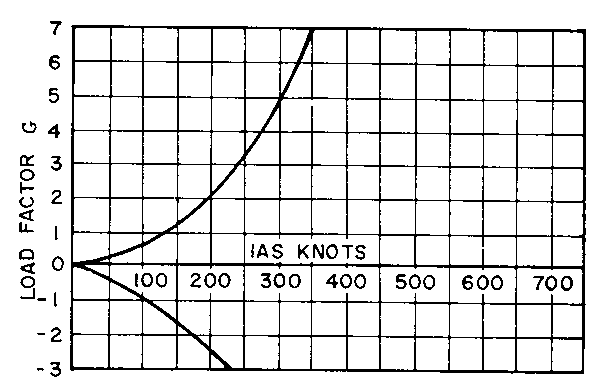
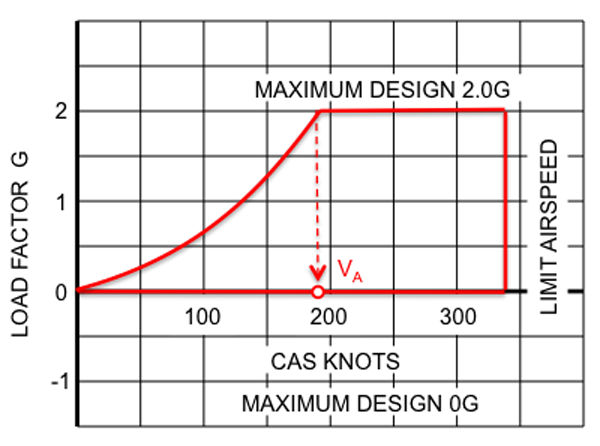
- The operating flight strength limitations of an airplane are presented in the form of a V-n or V-g diagram. This chart is usually included in the aircraft flight handbook in the section dealing with operating limitations. The V-n diagram presented [in the figure] is intended to present the most important general features of such a diagram and does not necessarily represent the characteristics of any particular airplane. Each airplane type has its own particular V-n diagram with specific V's and n's.
- The flight operating strength of an airplane is presented on a graph whose horizontal scale is airspeed (V) and vertical scale is load factor (n). The presentation of the airplane strength is contingent on four factors being known: (1) the aircraft grossweight, (2) the configuration of the aircraft (clean, external stores, flaps, and landing gear position, etc.), (3) symmetry of loading (since a rolling pullout at high speed can reduce the structural limits to approximately two-thirds of the symmetrical load limits), and (4) the applicable altitude. A change in any one of these four factors can cause important changes to operating limits.
Source: ATCM 51-3, pg. 334
ATCM 51-3, figure 5.4
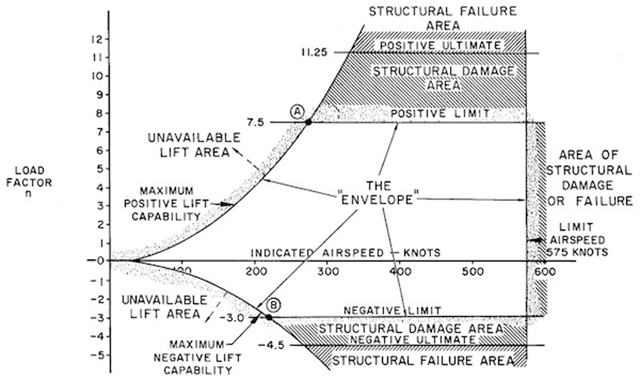
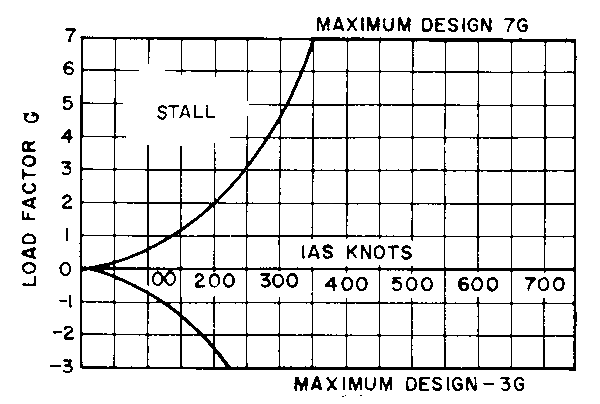
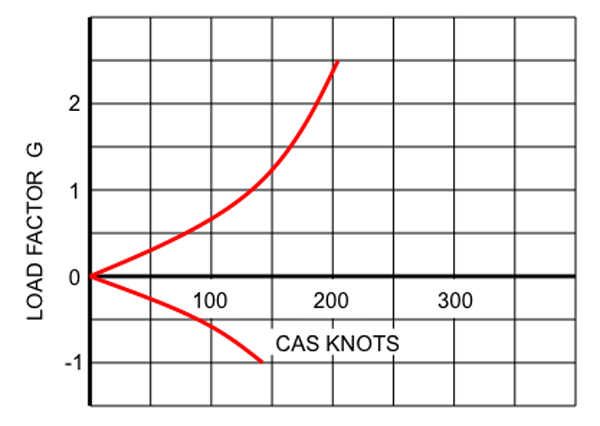
- The [second figure] provides supplementary information to illustrate the significance of the V-n diagram [shown earlier]. The lines of maximum lift capability are the first points of importance on the V-n diagram. The subject aircraft is capable of developing no more than one positive "g" at 100 knots, the wing level stall speed of the airplane. Since the maximum load factor varies with the square of the airspeed, the maximum positive lift capability of this airplane is 4 "g' at 200 knots, 9 g at 300 knots, 16 g at 400 knots, etc. Any load factor above this line is unavailable aerodynamically, i.e., the subject airplane cannot fly above the line of maximum lift capability.
- The limit airspeed (or redline speed) is a design reference point of the airplane — the subject airplane is limited to 575 knots.
- The airplane must be operated within this "envelope" to prevent structural damage and ensure that the anticipated service life of the airplane is obtained. The pilot must appreciate the V-n diagram as describing the allowable combination of airspeeds and load factors for safe operation.
- There are two points of great importance on the V-n diagram of [the figure]. Point B is the intersection of the negative limit load factor and line of maximum negative lift capability. Any airspeed greater than point B provides a negative lift capability sufficient to damage the airplane; any airspeed less than point B does not provide negative lift capability sufficient to damage the airplane from excessive flight loads. Point A is the intersection of the positive limit load factor and the line of maximum positive lift capability. The airspeed at this point is the minimum airspeed at which the limit load factor can be developed aerodynamically. Any airspeed greater than point A provides a positive lift capability sufficient to damage the airplane; any airspeed less than point A does not provide positive lift capability sufficient to cause damage from excessive flight loads. The usual term given to speed at point A is the "maneuver speed," since consideration of subsonic aerodynamics would predict minimum usable turn radius to occur at this condition. The maneuver speed is a valuable reference point since an airplane operating below this point cannot produce a damaging positive flight load. Any combination of maneuver and gust cannot create damage due to excess airload when the airplane is below the maneuver speed.
Source: ATCM 51-3, pg. 334
When I learned this in 1979 there was a well known caveat that was articulated this way: "Maneuver speed protection is not available for a rolling pull up." In other words, if you combine roll with pull, all bets are off. After the crash of American Airlines 587 it has been articulated in another, more useful way: Maneuvering speed is valid only when considering pitching moments with no aileron or rudder input. The old school house wisdom that "you cannot stall or overstress an airplane at VA is wrong. The formula for VA deals only with pitch and stall speed varies with g (you can stall an airplane above VA if you increase the load factor.
- The maneuver speed can be computed from the following equation:
- Of course, the stall speed and limit load factor must be appropriate for the airplane grossweight.
where
VP = maneuver speed
VS = stall speed
n limit = limit load factor
Source: Source: ATCM 51-3, pg. 334
It is vitally important to realize this number is valid only for the computed grossweight, altitude, and configuration.
2
V-g diagrams and VA
Dole, pg. 193
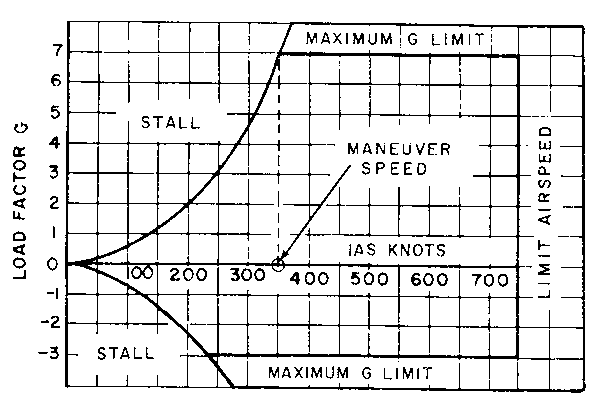
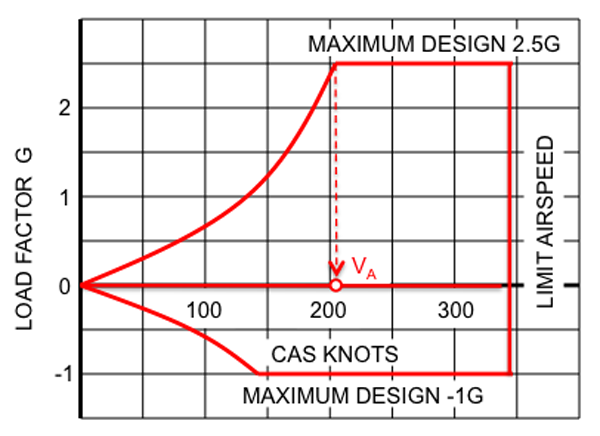
An interesting point on the V-g diagram is the intersection of the aerodynamic limit line and the structural limit line. The aircraft's speed at the point is called the maneuver speed, commonly called the corner speed. At any speed below this speed the aircraft cannot be overstressed. It will stall before the limit load factor is reached. Above this speed, however, the aircraft can exceed the limit load factor before it stalls. At the maneuver airspeed the aircraft's limit load factor will be reached at the lowest possible airspeed.
Source: Dole, pg. 193
Notice that nothing in the text or the diagram references altitude or weight. The aircraft obviously stalls at a different speed for varying altitudes and weights, and the available G changes as well. The VA published in your flight manual has more to do with the FAA's certification rules than it does about actually maneuvering your aircraft. For now, just realize that the published maneuvering speed in your aircraft flight manual is not what you think it is. More about this below when we construct a V-g diagram for an example aircraft.
3
Constructing V-g diagrams, theory
Dole, pg. 191
The V-g Diagram, a plot of the aircraft's available load factor (G) versus velocity (V), is a fundamental tool in determining aircraft performance, most notably its cornering speed. To an air combat pilot, cornering speed is the point where the pilot can pull in the pitch axis without fear of stalling or over-stressing the aircraft, producing the tightest possible turn. (An airplane pulls its way around a turn, the roll only serves to point the pitch vector.) To a corporate or airline pilot, this speed is known as Maneuvering Speed, VA and provides a topic for discussion but little more. More on this at VA.
To construct a V-g diagram, you must first plot the stalling speed of the aircraft at various load factors. Note that this speed changes with weight an altitude, so you will need a different chart for every combination of weight and altitude that interests you.
How do you compute stall speed for other than 1-G flight when that is all the aircraft flight manual gives you? With mathematical slight of hand. We've already seen, at Lift, the following:
and,
therefore,
If you set VS to be the stall speed at the G-Limit, VS(1G) to be the stall speed for 1-G flight, and assume CL, W, and ρ do not change:
Then with some division:
Dole, pg. 192
I took the absolute value of G because we will be dealing with negative G's and you can't very well be dealing with imaginary numbers when talking about maneuvering speed. There is a mathematical justification for this, but for the life of me I can't remember it. But it works.
The second step in constructing a V-g diagram is to plot the positive and negative load factor limits. This tends to be fairly straight forward.
Dole, pg. 192
The third step in constructing a V-g diagram is to add the limiting speed.
The fourth step is to add maneuvering speed, which occurs at the intersection of the positive load factor limit and the aerodynamic stall line.
4
Constructing V-g diagrams, example
The VA maneuvering speed in your flight manual is just a number picked by your manufacturer to satisfy the requirements of 14 CFR 25.335 which only requires the speed cannot be less than the stalling speed of the aircraft with the flaps retracted and does not specify a weight or altitude. If you would like the maneuvering speed for any other configuration, weight, or altitude, you will need to construct a V-g diagram for those conditions.
I did precisely that when called upon to conduct combat operations in an Air Force Gulfstream III into Sarajevo back when there was a shooting war going on. (See At Least They Aren't Shooting at Us.) The AFM published VA of 206 knots would have been the wrong speed to "yank and bank" under enemy fire on takeoff where the correct speed would have been 196 knots, or on arrival where the correct speed was 151 knots. A 55 knot error seemed significant enough, but how many people are using VA in the peacetime world?
There is an increased emphasis on maneuvering aircraft in an Unusual Attitude situation and some are advocating that flying at VA gives you a license to maneuver to your heart's content. It does not but studying a V-g diagram helps you understand your aircraft's operating envelope.
I shall construct three V-g diagrams and derive VA for a Gulfstream G450 for these conditions as a demonstration for others wanting to do the same, and to provide the numbers for myself:
- Typical Landing at 1,000' Pressure Altitude (Gear Down, Flaps 39°, 50,000 lbs)
- Heavy Weight Takeoff at 1,000' Pressure Altitude (Gear Up, Flaps 20°, 74,600 lbs)
- Heavy Weight Climb at 3,000' Pressure Altitude (Gear Up, Flaps Up, 70,000 lbs)
I'll go through the steps in detail for the first example and then more quickly for those that follow.
Landing - stall charts
Using Gulfstream G450 performance charts, we see the flaps 39° stall speed at 50,000 lbs and 1,000 feet pressure altitude is 98 KCAS.
Landing - Derive Range of Stall Speeds for G-Envelope
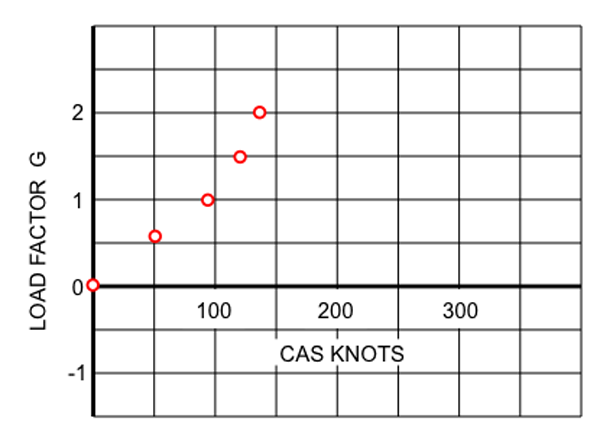
V-g chart, step 1
Recall that
We can use that formula to derive a range of stall speeds for varying G loads:
| G | VS |
|---|---|
| 0 | 0 |
| 0.5 | 69 |
| 1.0 | 98 |
| 1.5 | 120 |
| 2.0 | 139 |
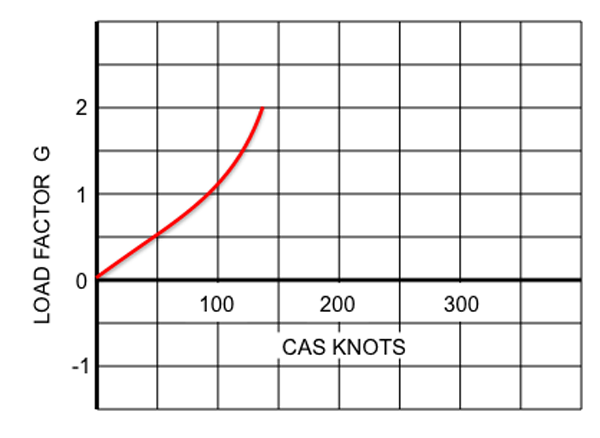
V-g chart, step 2
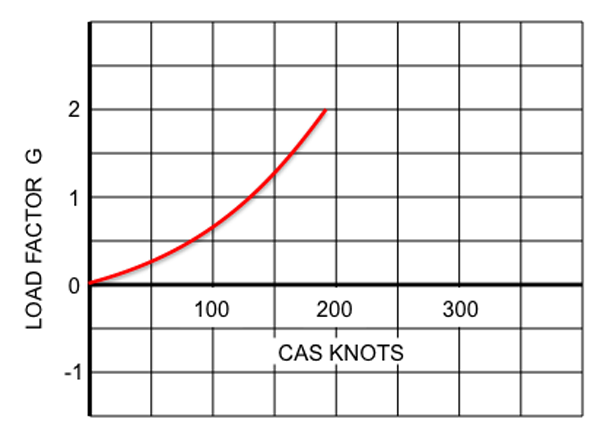
We plot that on a graph of load factors on the vertical axis and speeds on the horizontal axis.
We can fit a curve to replace the dots. Because of the stall chart value was rounded to the nearest 1 knot, errors are magnified on this chart so the curve may not fit exactly. As will be clear a few steps later, the critical bit is the KCAS for the load factor limit.
Landing - add G-limits
V-g chart, step 3
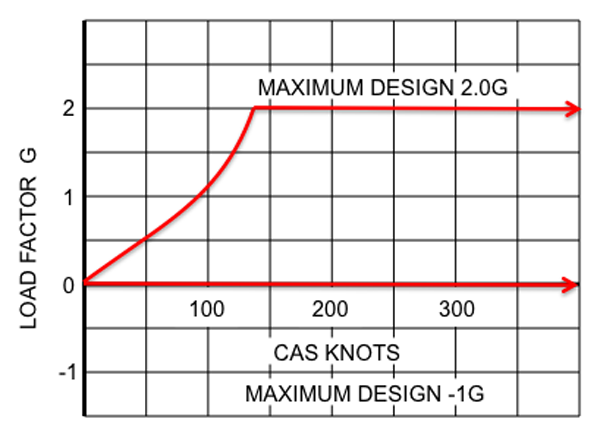
We know from G450 limitations the flight load acceleration limits with Flaps 39° up to landing weight are 0 to 2.0 G. We can plot these as well.
V-g chart, step 4
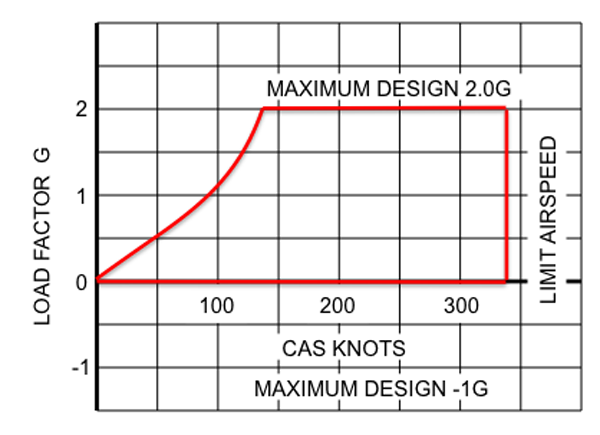
Because the V-g Diagram should show the aircraft's envelope, we can add the limiting airspeed to the chart.
Landing - determine corner speed (VA)
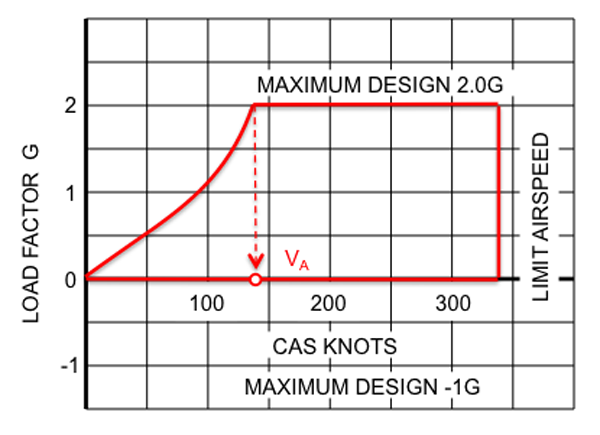
VA maneuvering speed is where the maximum stall speed intersects with the maximum load factor. Graphically, it occurs in the top left corner, the reason some call this "corner speed.'
The G450 published VA of 206 KCAS is much higher than the true VA for a G450 in landing configuration at 50,000 lbs gross weight and 1,000 feet pressure altitude. Full control deflection at 206 knots in this situation could very well overstress the aircraft.
V-g chart, step 5
Takeoff - stall charts
Using Gulfstream performance charts, we see the flaps 20° stall speed at 74,600 lbs and 1,000 feet pressure altitude is 132 KCAS.
Takeoff - derive range of stall speeds for G-envelope
V-g chart, takeoff stall speeds
Recall that:
We can use that formula to derive a range of stall speeds for varying G loads:
| G | VS |
|---|---|
| 0 | 0 |
| 0.5 | 93 |
| 1.0 | 132 |
| 1.5 | 162 |
| 2.0 | 187 |
Takeoff - add G-limits
We know from G450 limitations the flight load acceleration limits with Flaps 20° are 0 to 2.0 G.
Takeoff - Determine Corner Speed (VA)
Just as we did for the landing example, we can plot the G-Limits, airspeed limits, and find the corner speed. In this case, VA = 187 KCAS, still much lower than the published number of 206 KCAS.
V-g chart, takeoff with G-limits
Climb - stall charts
V-g chart, climb stall speeds
Using Gulfstream performance charts, we see the flaps 0° stall speed at 70,000 lbs and 3,000' pressure altitude is 130 KCAS.
Recall that
| G | VS |
|---|---|
| -1.0 | 130 |
| 0 | 0 |
| 1.0 | 130 |
| 2.0 | 184 |
| 2.5 | 206 |
Because the load factor limit now includes negative G-loads, we must also plot the speeds at -1.0 G.
Climb - Add G-limits and determine corner speed
We know from G450 limitations the flight load acceleration limits with Flaps 0° are -1.0 to 2.5 G.
V-g chart, climb chart completed
Now we finally see a VA that equals the published number of 206 KCAS. This isn't the only one, there are many combinations of weight and pressure altitudes that will yield this number.
G450 VA
| Gulfstream G450 Maneuvering Speed (Sea Level) | |||
| Gear | Flaps | Weight | VA |
| Down | 39 | 50,000 lbs | 139 knots |
| Up | 20 | 74,600 lbs | 187 knots |
| Up | Up | 70,000 lbs | 206 knots |
As we can see, the published VA is rarely right. Do you need to memorize an continuum of VA's? No, not at all. Maneuvering speed is a certification issue. When controlling your aircraft, do so with a gentle hand and you can avoid overstressing or stalling without the benefit of this made up number. The next time a simulator instructor recommends you fly this speed and the maneuver as required, nod politely and ignore the suggestion.
References
(Source material)
Air Training Command Manual 51-3, Aerodynamics for Pilots, 15 November 1963
Dole, Charles E., Flight Theory and Aerodynamics, 1981, John Wiley & Sons, Inc, New York, NY, 1981.
Please note: I've used some Gulfstream performance charts for the purposes of education. Gulfstream Aerospace Corporation has no affiliation or connection whatsoever with this website, and Gulfstream does not review, endorse, or approve any of the content included on the site. As a result, Gulfstream is not responsible or liable for your use of any materials or information obtained from this site.