Angle Of Attack is a staple of military aviation that seems to have been ignored by much of the civilian world. Too bad, AOA can save your life when the chips are down. Most pilots know that their wings stall at a particular angle of attack, depending on flap and other high-lift device settings. But years of simulator training has put the focus on airspeed which is only a by product of AOA.
— James Albright
Updated:
2023-12-07
What follows is a discussion of what AOA actually is, how it affects the coefficient of lift, and what happens to airflow over the wing as it is increased to a critical value. Then we'll see how the AOA indication system works on a T-38 and a G450. You might enjoy Everybody Has an Angle (of Attack), a story about how all this was trained to Air Force pilots many years ago.
1
The aerodynamics of AOA
The technical stuff . . .
Angle of Attack
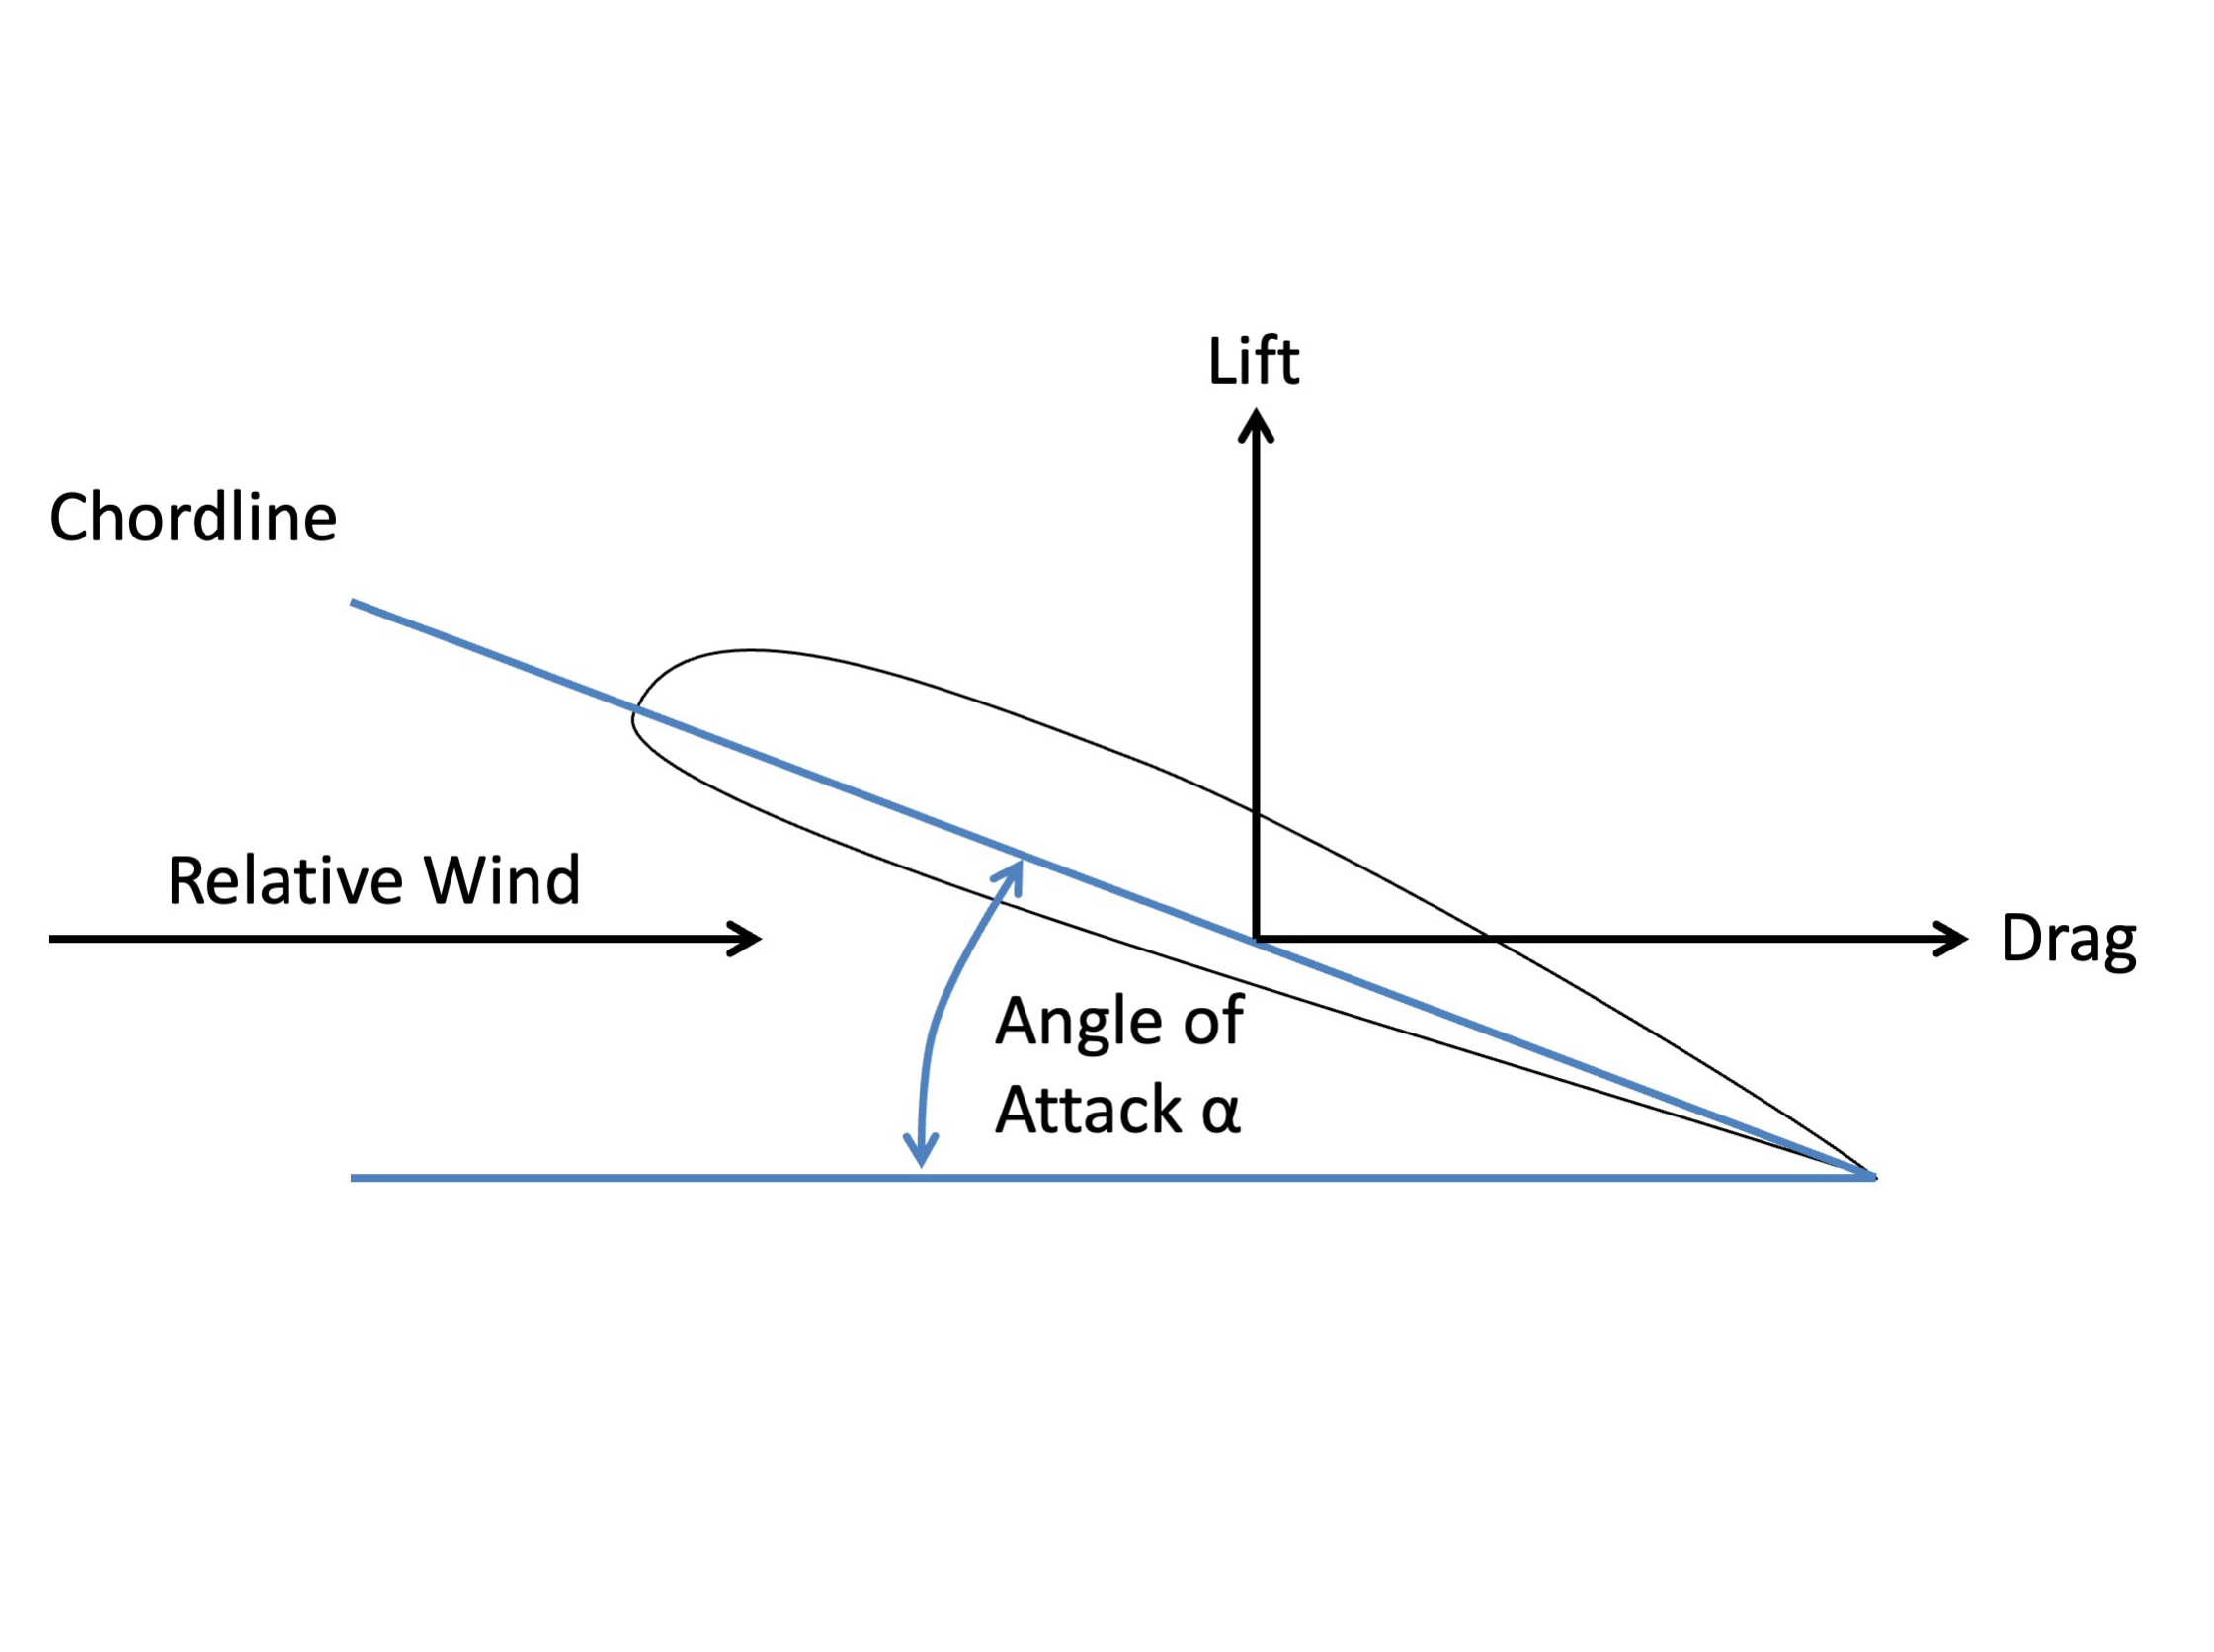
As an airfoil cuts through the relative wind, an aerodynamic force is produced. This force can be broken down into two components, lift and drag. The lift produced by an airfoil is the net force produced perpendicular to the relative wind. The drag incurred by an airfoil is the net force produced parallel to the relative wind. (For more about aerodynamic force, see lift.)
The angle of attack is the angle between the chord line and the relative wind.
AOA impact on lift
CL vs. Angle of Attack
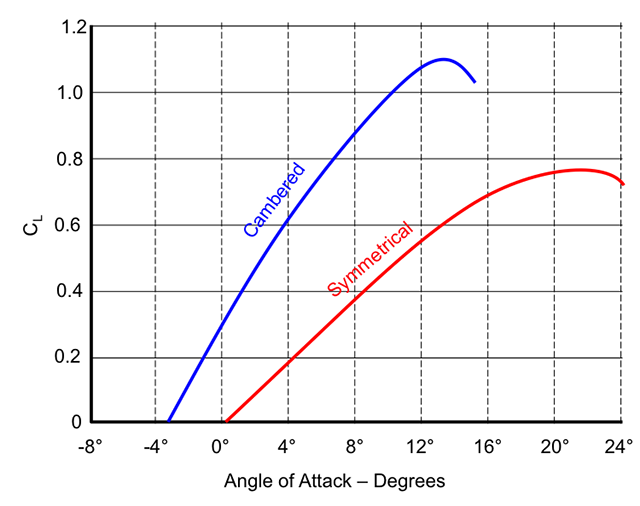
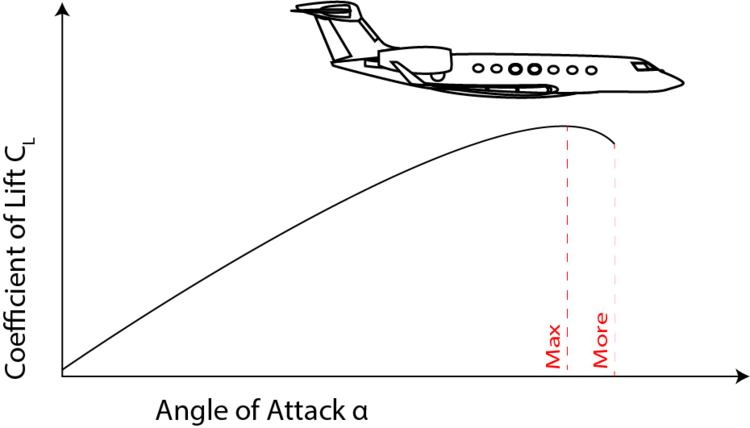
The coefficient of lift is a measure of how much lift the wing can produce and can only be changed by changing the shape of the wing or the angle of attack at which it cuts through the relative wind. We can change the shape of the wing using flaps, slats, or other similar leading and trailing edge devices. We change the angle of attack using our flight controls and, in some cases, power settings.
For any given wing, an increase in angle of attack leads to an increase in the coefficient of lift up until the point it doesn't. In the graph shown, we see that a typical cambered wing produces a higher coefficient of lift but when it gets to its critical angle of attack, the lift drops off quickly. A symmetrical wing, on the other hand, produces less total lift but when it drops off, it drops off slowly.
The importance of AOA in determining aircraft performance cannot be overemphasized. We have discussed stall AOA, but these facts are of equal importance: an aircraft has its maximum climb angle at a certain AOA, will achieve maximum rate of climb at another AOA, and will get maximum range at still another AOA.
Source: Dole, pg. 36
Boundary layer
ATCM 51-3, pg. 53
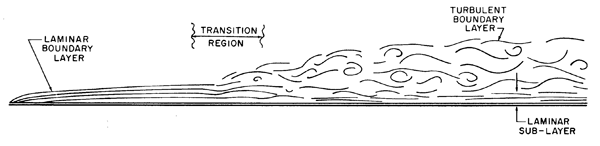
To understand airfoil performance at high angles of attack, one must first consider the airflow at just about any angle of attack. When an airfoil passes through an airstream, the particles of air right next to the skin of the airfoil are pulled along at the same speed of the airfoil. As you get further away from the skin of the airfoil, the particles are less apt to "grab on" to the wing and at a certain distance they do not "grab on" at all. This layer of air, the particles that grab on to the wing completely to those that don't, is known as the boundary layer.
The behavior of the boundary layer determines, in great measure, the maximum lift coefficient and the stalling characteristics of the airfoil.
The beginning of airflow at the leading edge of a smooth airfoil surface produces a very thin layer of smooth airflow. This type of airflow is called laminar flow and is characterized by smooth regular streamlines. Fluid particles in this region do not intermingle. As the airflow moves back from the leading edge, the boundary layer thickens and becomes unstable. Small pressure disturbance cause the unstable airflow to tumble, and intermixing of the air particles takes places. This type of airflow is called turbulent flow.
Source: Dole, pg. 39
Adverse pressure gradient
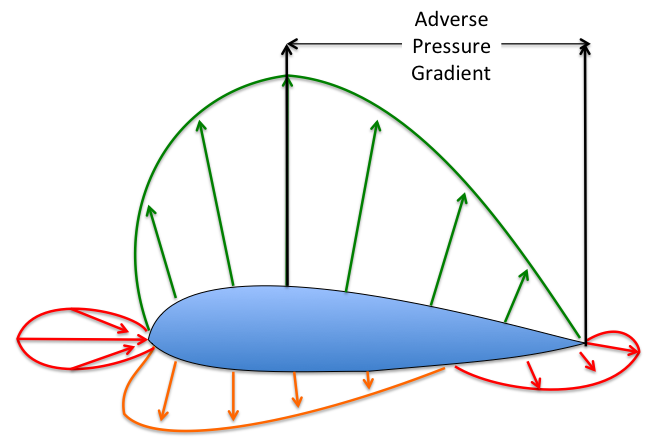
Adverse pressure gradient
As we saw in our discussion of lift, the pressure over and under the wing decreases as the velocity of the air increases. The pressure differential over the top and under the bottom of the wing generate the aerodynamic force that becomes lift and drag.
The point of minimum pressure divides the airfoil into two. Forward of that point the pressure gradient is helping to produce lift and, to a lesser degree, a pulling force forward. Aft of that point we have what is called the adverse pressure gradient. The pressure here contributes to drag and a separation of the air flowing over the wing.
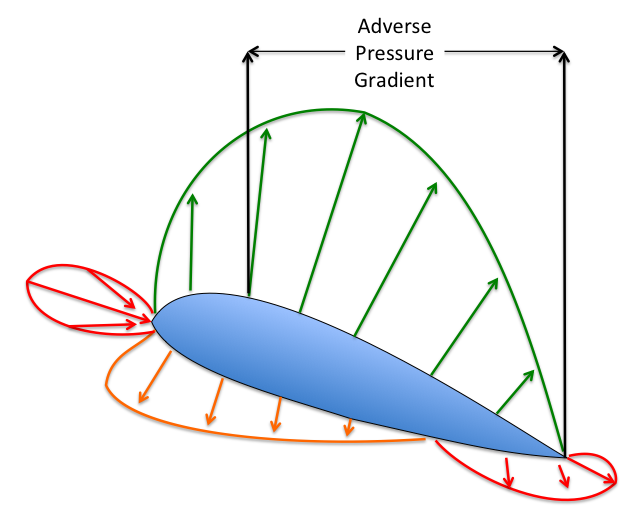
Adverse pressure gradient increased
As the angle of attack is increased, the point of minimum pressure moves forward and the size of the adverse pressure gradient increases. Three things happen as a result:
- The lift component of aerodynamic force increases, up to a point.
- The drag component of aerodynamic force increases.
- The turbulent flow area increases, encouraging separation of the boundary layer.
Airflow Separation
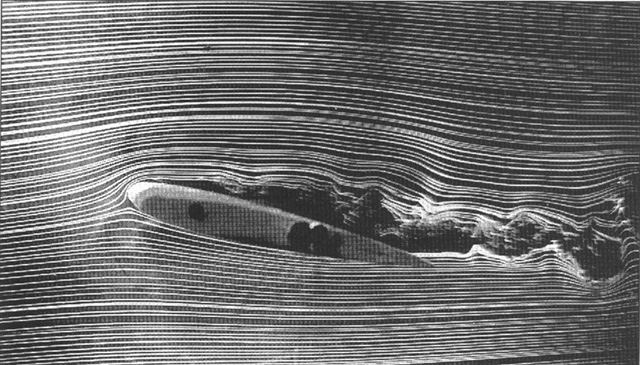
Wing stall
The friction along the airfoil tends to reduce the velocity of the air particles right next to the surface to zero, forming a thin boundary layer of air. The adverse pressure gradient tends to expand the boundary layer to the point the air particles separate and are neither flowing with the relative wind or sticking to the airfoil.
The result of the air slowing creates a stagnated region close to the surface of the object. Airflow from outside the boundary layer will overrun the point of stagnation and cause the the boundary layer to separate from the surface. A flow reversal results, and the airflow moves forward, lift is destroyed, and drag becomes excessively high.
Source: Dole, pg. 43
Stall
The airflow separation can happen under conditions of slow speed flight, high-G maneuvering, or high speed shock waves. All three were of concern to us in the supersonic T-38, the first two are concerns for all jet aircraft. More about this in the articles Low Speed Flight, and Operating Flight Strength (V-g / V-n Diagrams).
While we are on the subject of AOA, however, it may be helpful to look at two aircraft systems for detecting and displaying AOA to the pilot.
2
Example system: the T-38
Where AOA began for me . . .
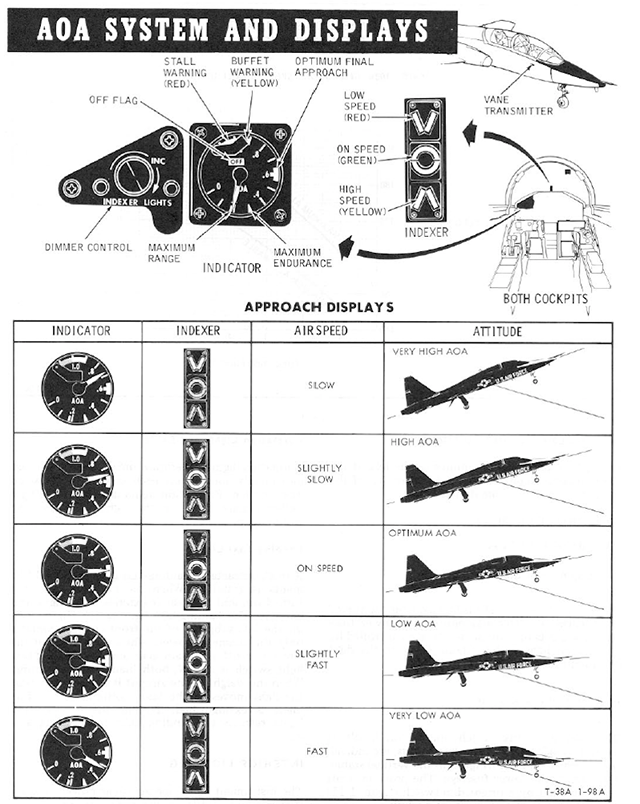
We aren't in the business of flying supersonic on razor thin wings, but this illustration from the T-38 manual gives an excellent primer on AOA versus airspeed.
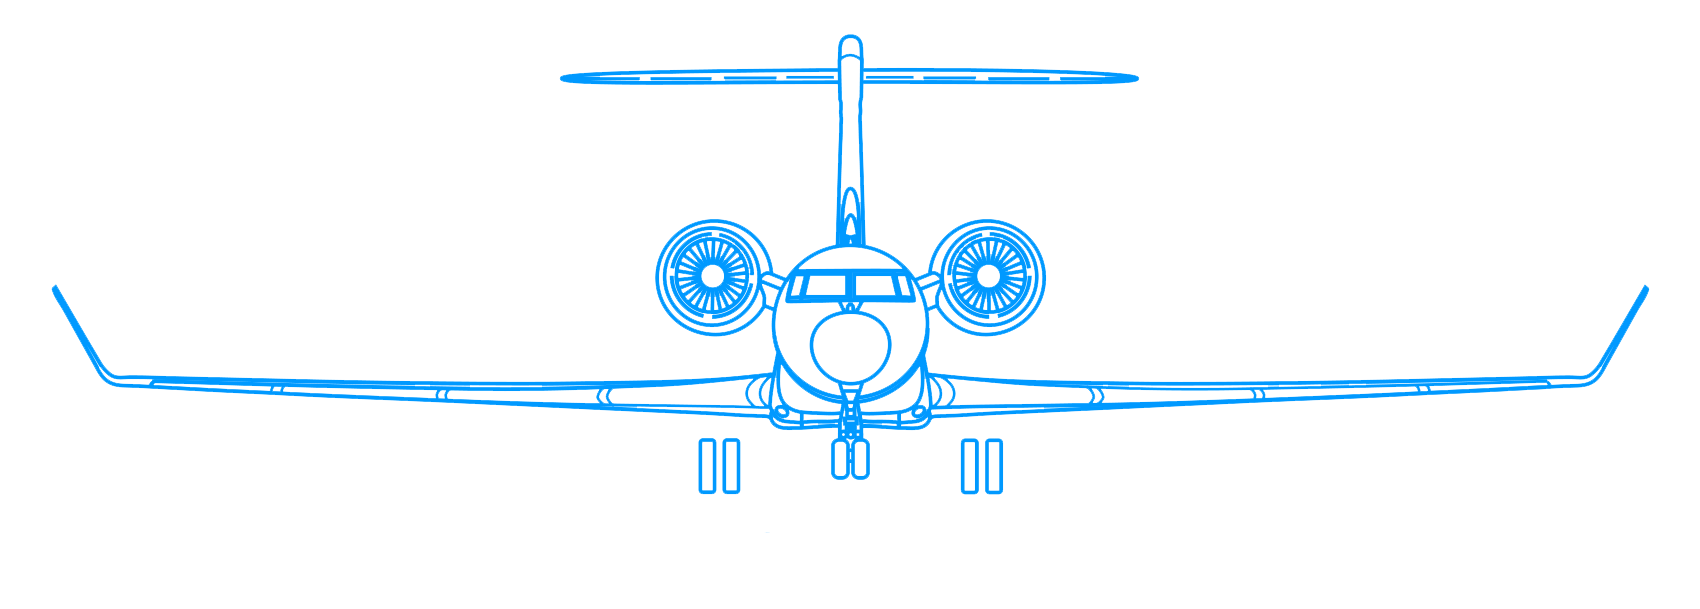
Drawing: G500 Front View
The [ARU-26/A AOA] indicator presents AOA as a percentage of maximum lift AOA. The dial is calibrated in unites of .1 counterclockwise from 0 to 1.1. Each unit represents approximately 10% of aircraft lift, from 0% and 0 indication to 100% at 1.0 indication. Three preset fixed indices and two colored arcs on the dial indicate the following:
- .18 White Index — Maximum Range (1-G flight)
- .3 White Index — Maximum Endurance (1-G flight)
- .6 White Index — Optimum Final Approach at 3-o'clock Position (1-G flight)
- .9 to 1.0 Yellow Arc - Buffet Warning
- 1.0 to 1.1 Red Arc - Stall Warning
Source: 1T-38A-1, pg. 4-18
3
Normalized angle of attack
NAOA = AOA?
Gulfstream calls their displayed angle of attack value to be a "normalized angle of attack," which is just a way to confuse things a bit. The normalized AOA is simply the way everyone else refers to AOA on the pilot's meter: 1.0 is stall, 0.0 is zero G. They explained it thusly in a mishap report:
NTSB AAR-12/02, figure 2.
Normalized AOA is a measure of the usable AOA range of an airplane, with a normalized AOA of 1.0 corresponding to the reference stall AOA in free air and a normalized AOA of 0.0 corresponding to the zero-lift AOA in free air. This figure is presented for information purposes only and is not intended to depict the flight conditions on the day of the accident.
NTSB AAR-12/03, ¶1.1
"Available AOA"
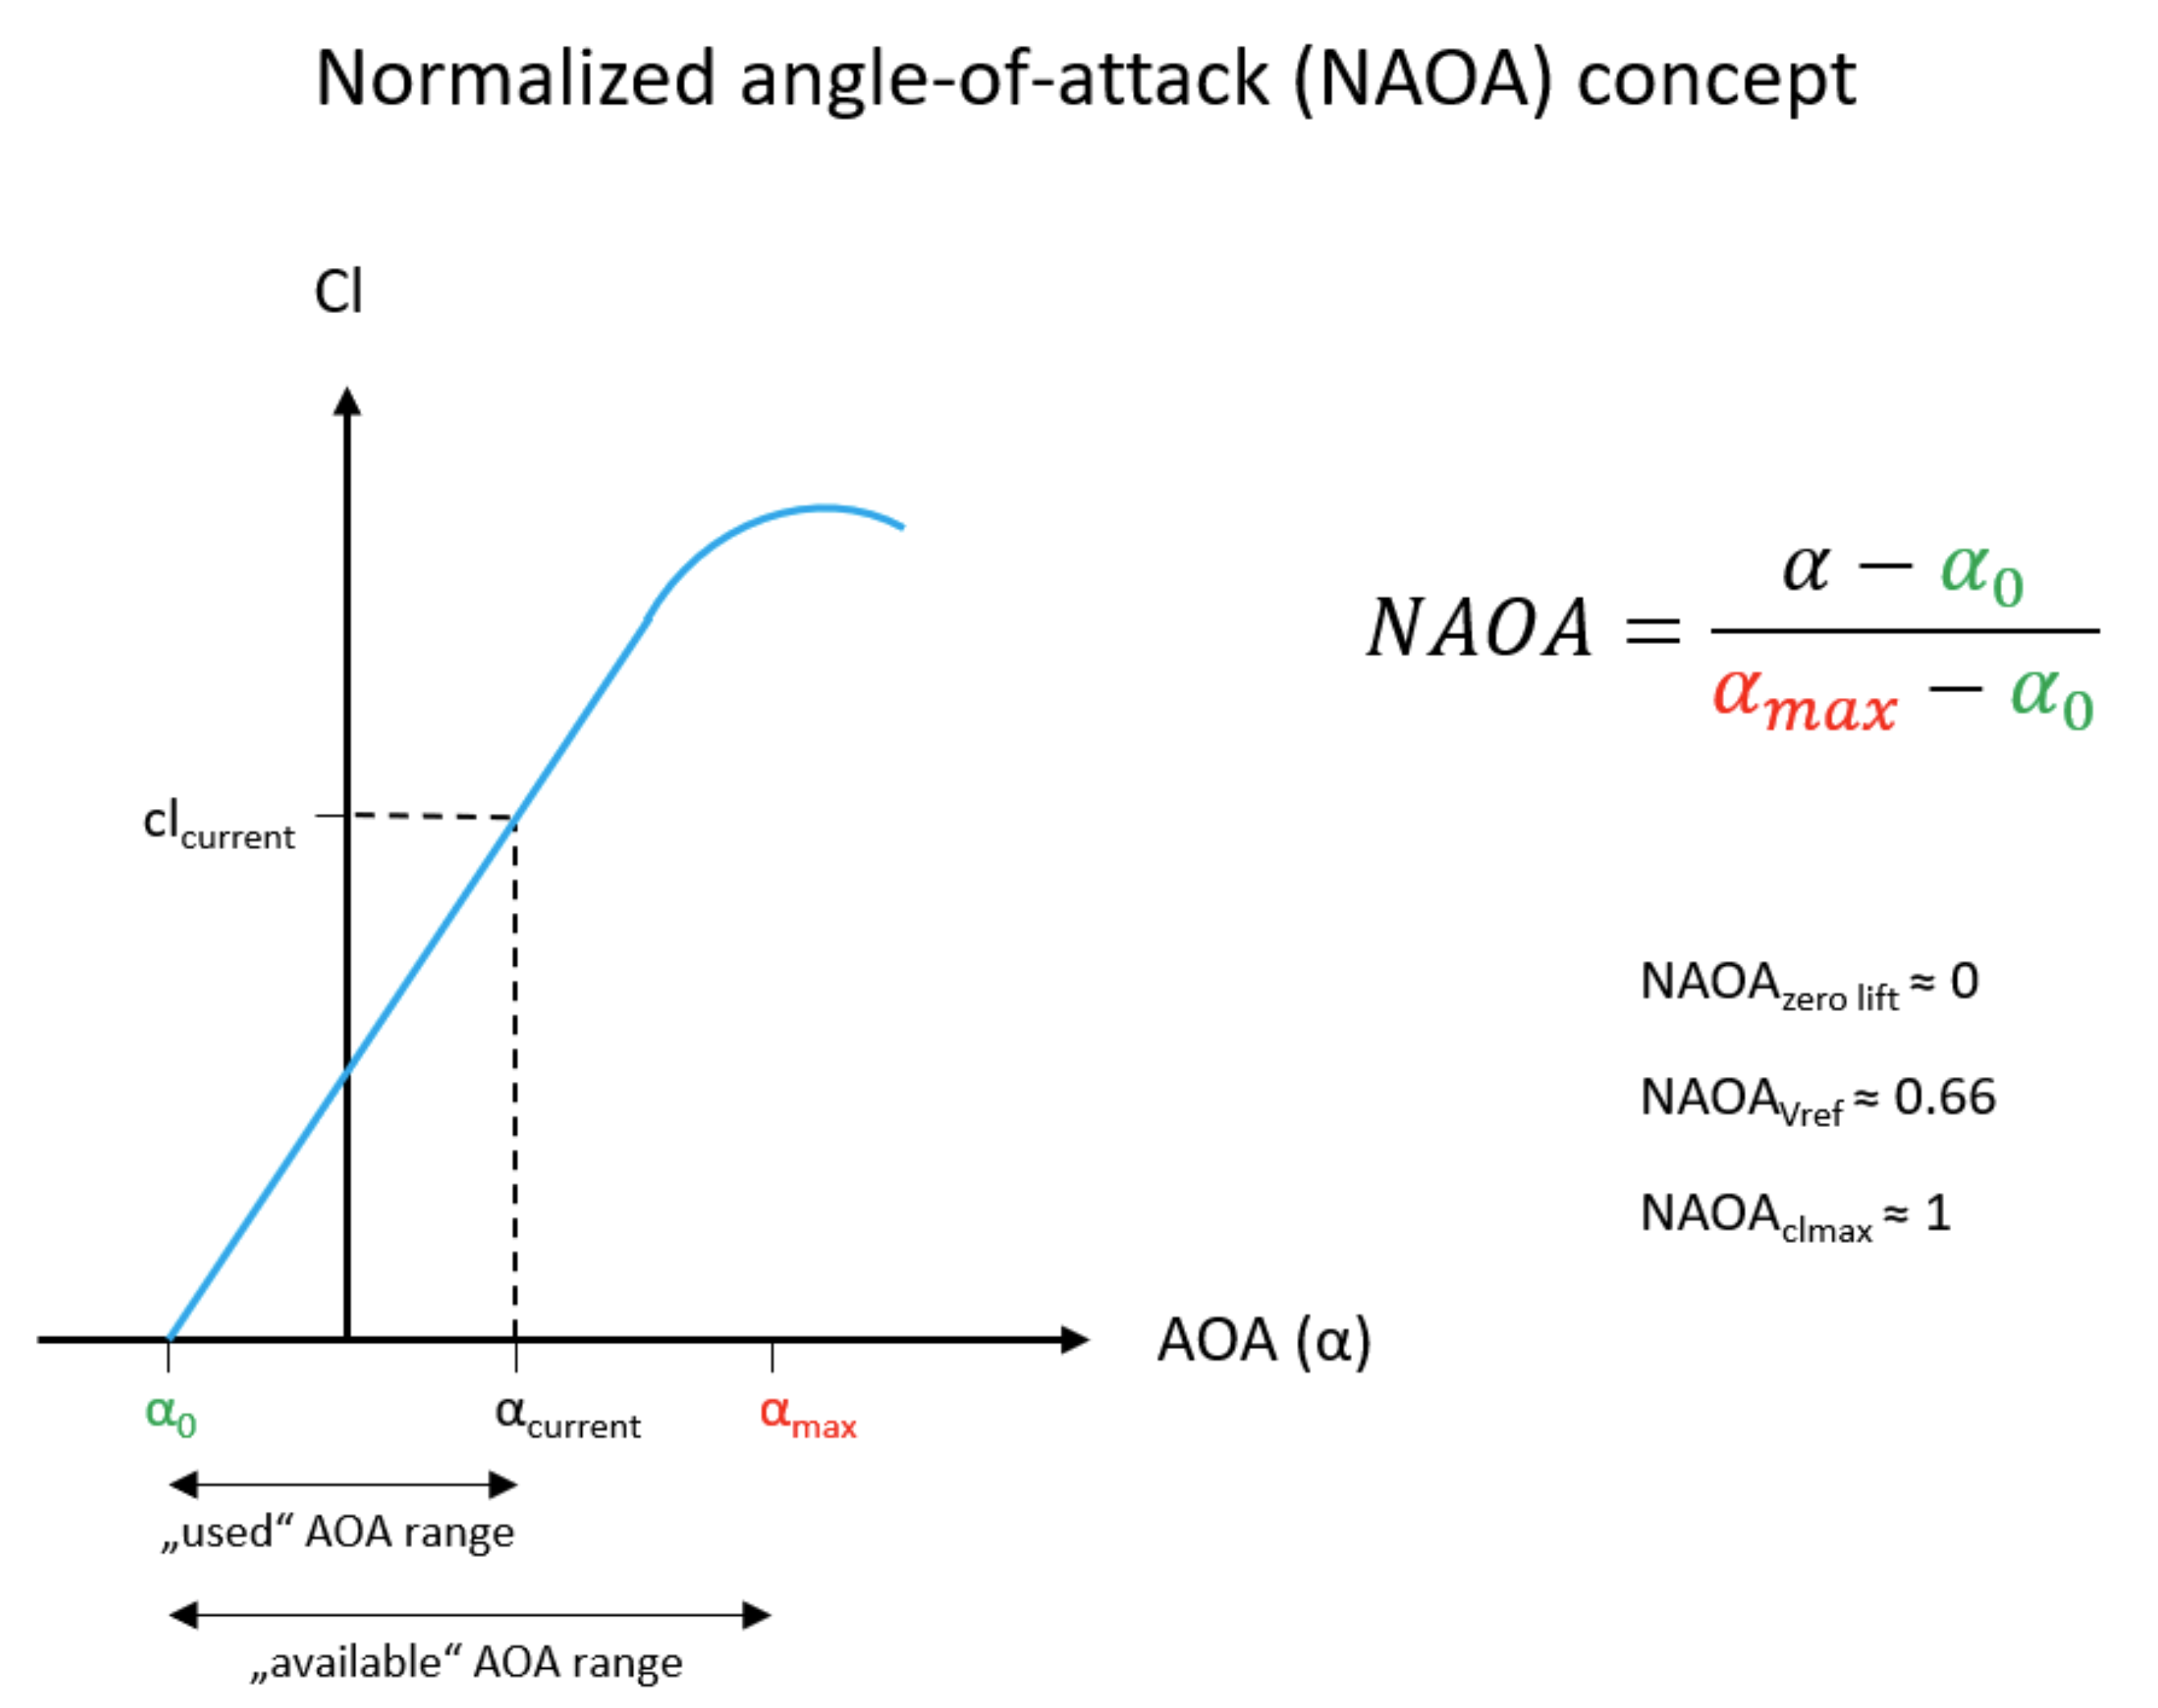
NAOA concept,
Andreas Horn (www.engineeringpilot.com)
An aeronautical engineer speaks of "available AOA" as the range of angle of attack which produces useful lift, though the exact range of when that occurs is not really specified. As pilots, we can think of available AOA as "available load factor," the range of AOA we have to keep the aircraft flying or turning. This concept is important, because you can keep flying and turning, but the amount of AOA used for one subtracts from the other. That's why your stall speed goes up in a turn and why at high angles of attack you cannot turn as well.
4
Example system: the G450
A modern example . . .
G450 AOM, § 2B-05-00, pg. 25
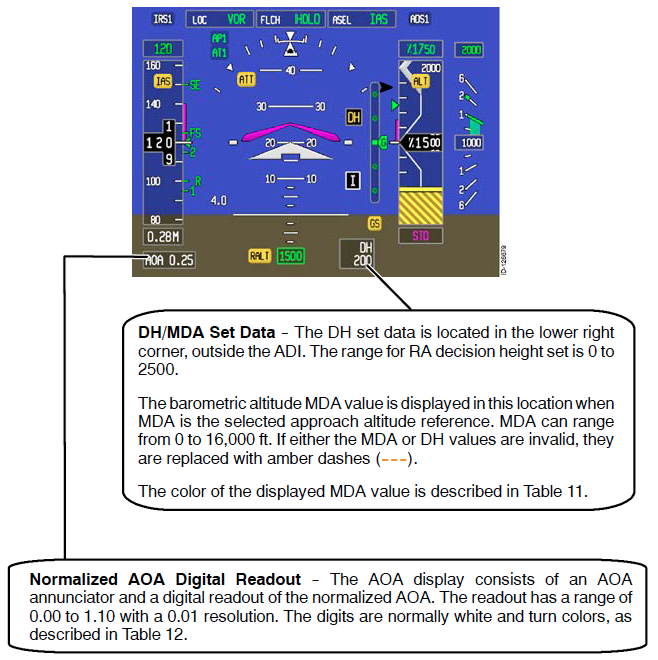
Not all modern aircraft include an AOA display for pilot use in flight, only using the information for stall warning protection. The CL-604, for example, has an AOA indicator marked "Not for use inflight." The G450, on the other hand, does include an AOA indicator on the Pilot's Flight Display. It is normalized AOA, even though the manual, however, is silent on the subject of "normalized AOA."
5
AOA versus HUD symbology
Not what you've been taught . . .
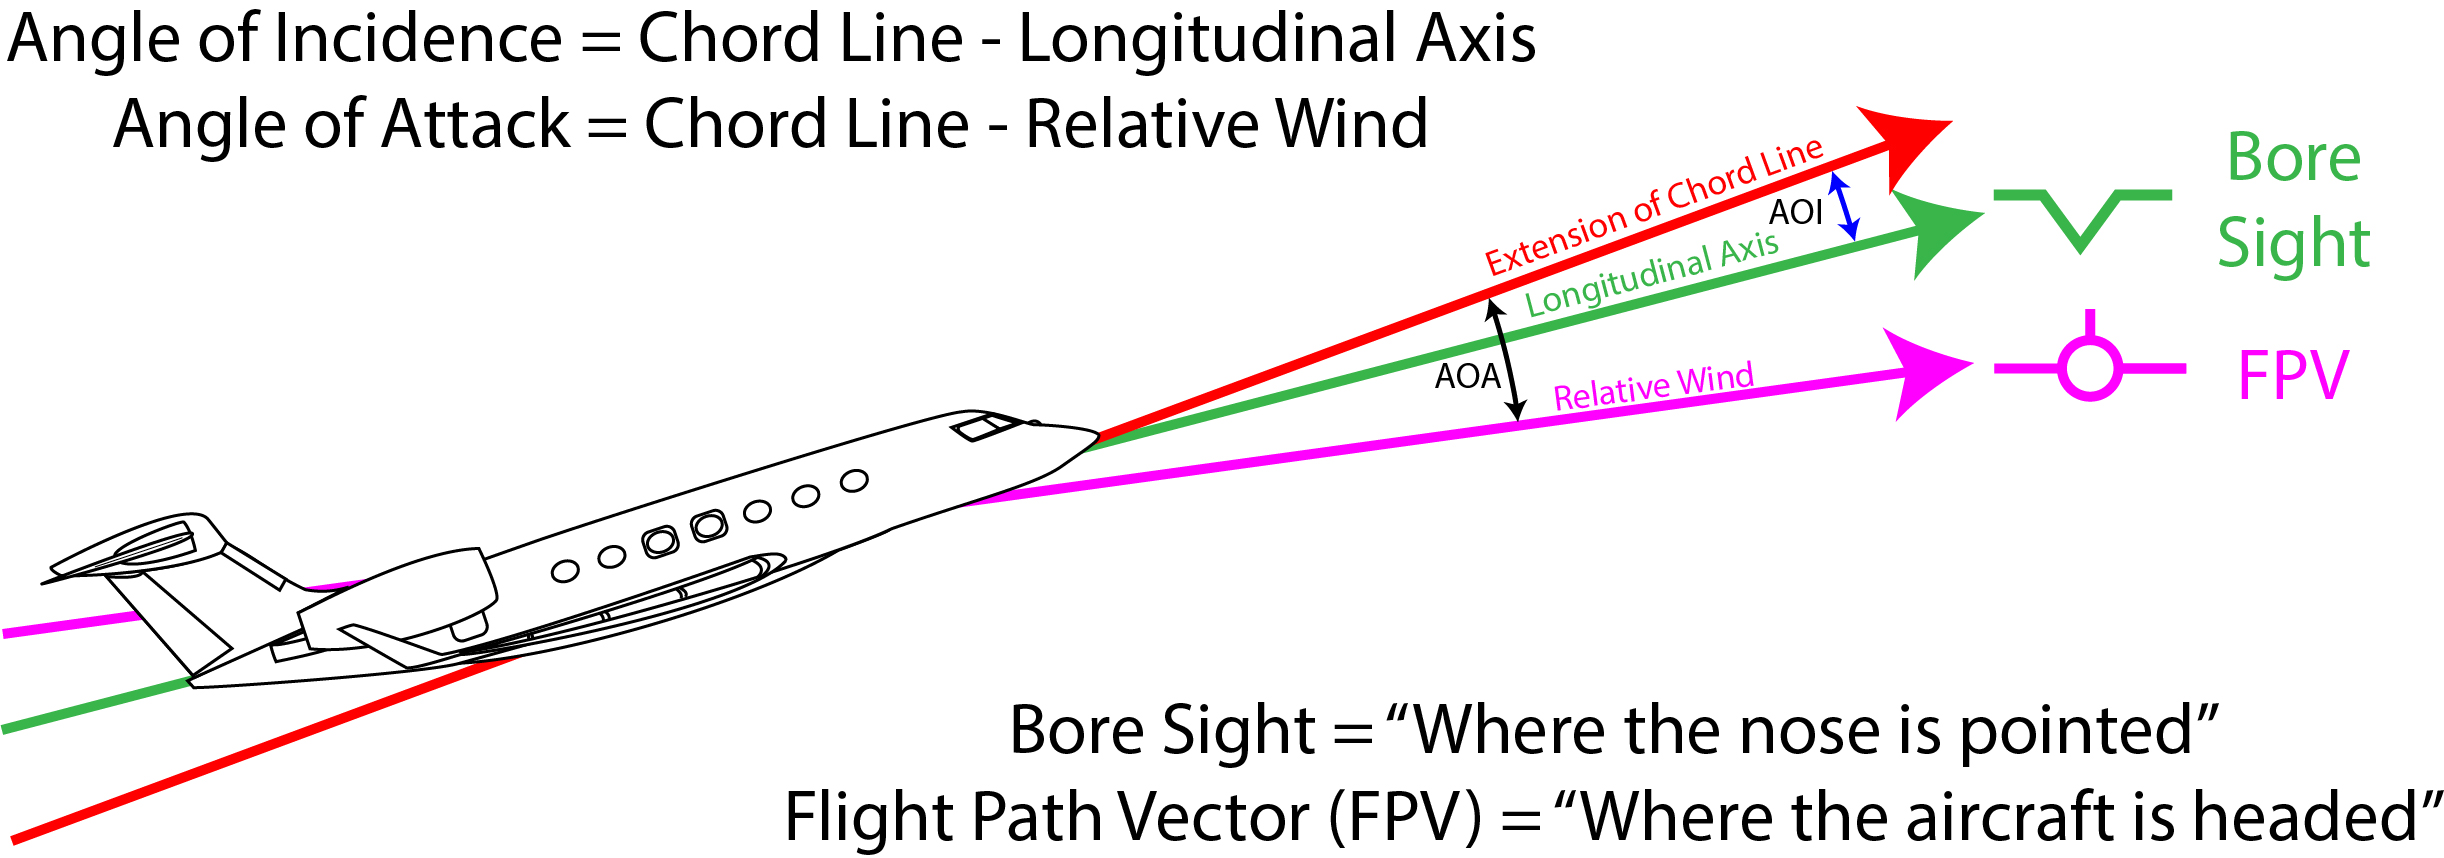
AOA, AOI, FPV, and the bore sight
The advent of the "Flight Path Vector" (FPV) gave pilots an instantaeous indication of where the aircraft is heading, a much more useful tool than the simple aircraft symbol found on most attitude indicators of the time. To take that symbol's place, a bore sight was added which simply showed where the nose was pointing. All that was great.
Where things went off the rails was when simulator instructors taught that the gap between the bore sight and the FPV was the aircraft's Angle of Attack (AOA). That isn't true. Remember that AOA is defined as the angle between the chord of the wing and the relative wind. Yes, the FPV does point to the relative wind. But the bore sight is almost never coincident with the wing's chord line. The wing is almost always mounted with a positive angle of incidence on the fuselage.
Conclusion: you can think of the angle between the bore sight and FPV as related to AOA, except you have to remember to subtract the Angle of Incidence (AOI). Is this important? Maybe not. But the first time you see the FPV above the bore sight, it will get your attention. While uncommon, it doesn't mean you have a negative angle of attack!
6
How to use AOA
Every day applications . . .
Most civilian aircraft seem to be silent on the subject of actually flying by reference to an AOA indicator, so I certainly can't recommend you do that. But I do recommend you keep an eye on it and see what it normally indicates for various phases of flight. I've done that for many of the aircraft I've flown and have come up with a conclusions.
"Maximum AOA"
"Max and More" AOA
We pilots are often taught that the airplane stalls and falls out of the sky at a critical angle of attack and that AOA is 1.0. Our conclusion: exceed 1.0 AOA and you die. Not true. Most wings have a somewhat gradual drop off from their maximum AOA. While it is true you get less lift after 1.0 NAOA, which is defined as the maximum AOA, you do get some.
If you find yourself in an aerodynamic stall, break the stall by reducing the angle of attack. But what if you are so low to the ground you don't have that option? My advice: fly with finesse and get as much lift as you can from what you have left.
Stall warning
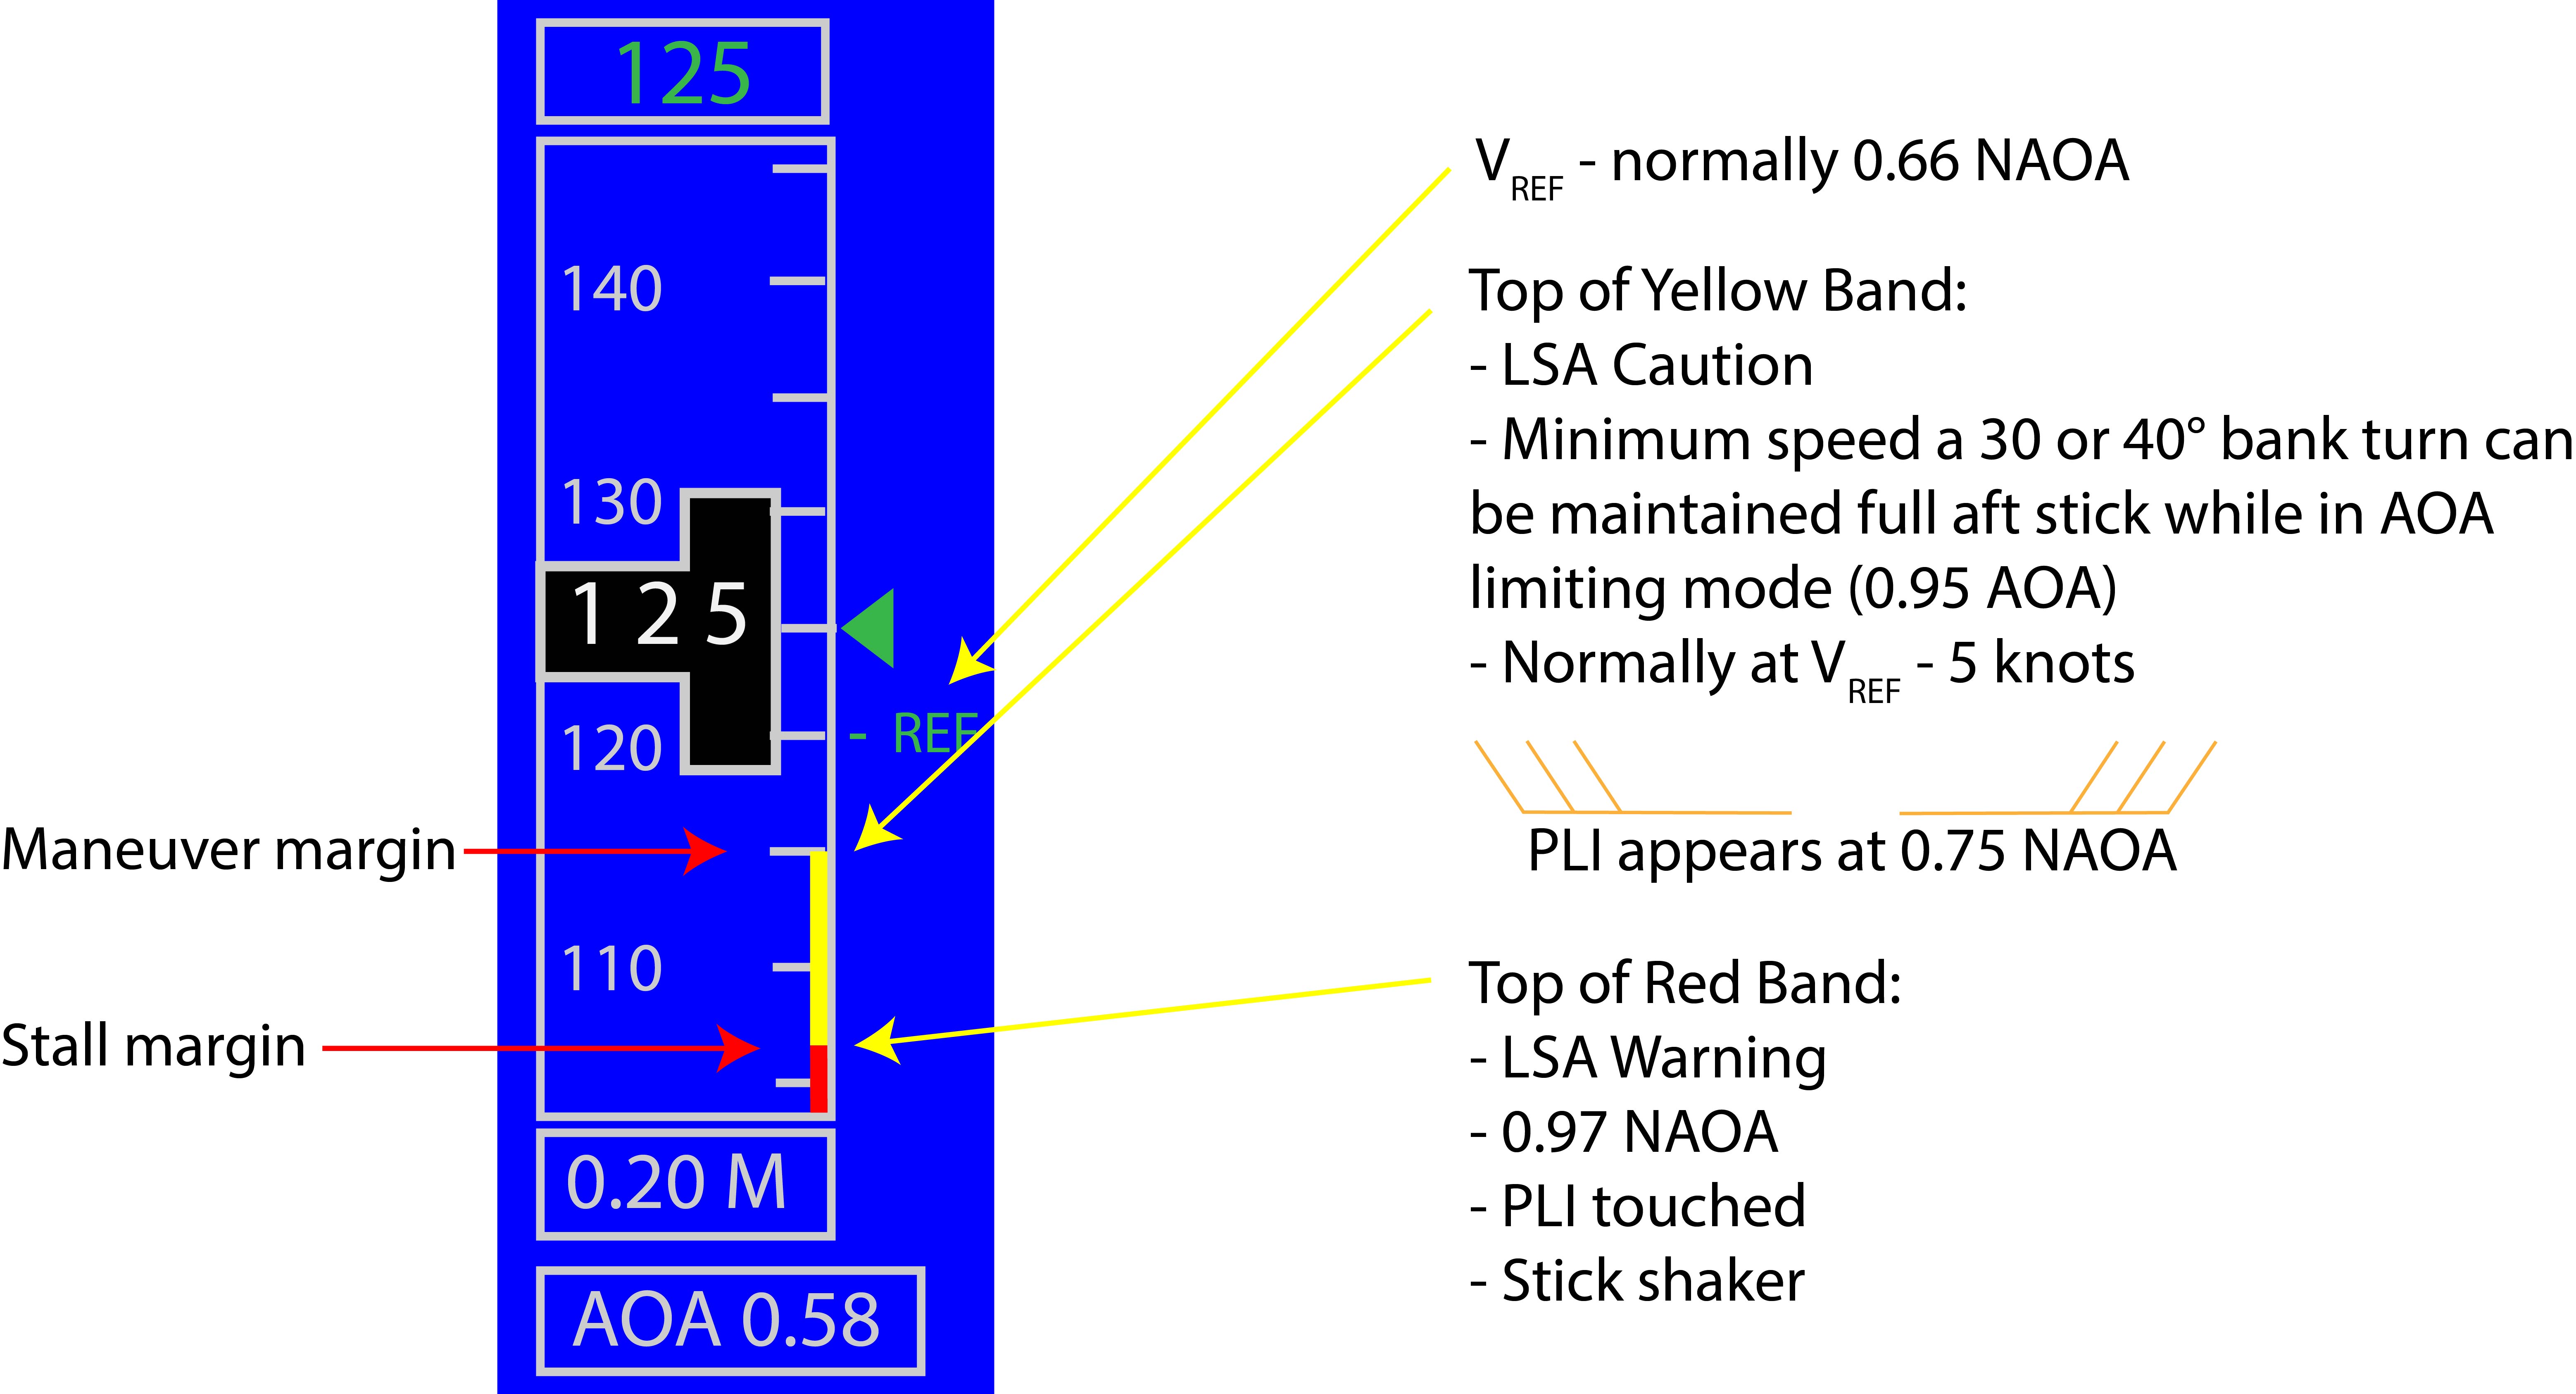
Most aircraft will warn you of an impending stall with a margin before the aerodynamic stall, which is said to occur at 1.0 NAOA. Warning systems include visual lights and other displayed messages, aural signals, and tactile vibrations such as produced by stick shakers. When the warnings occur are not always spelled out with certainty. The latest Gulfstreams are exceptionally well documented and the airplane provides the pilot with several cues:
- 0.97 NAOA — Stick shaker, "Low Speed Awareness" warning, a red band reaches current airspeed on the indicator.
- 0.95 NAOA — A "Low Speed Awareness" caution, a yellow band reaches current airspeed on the indicator.
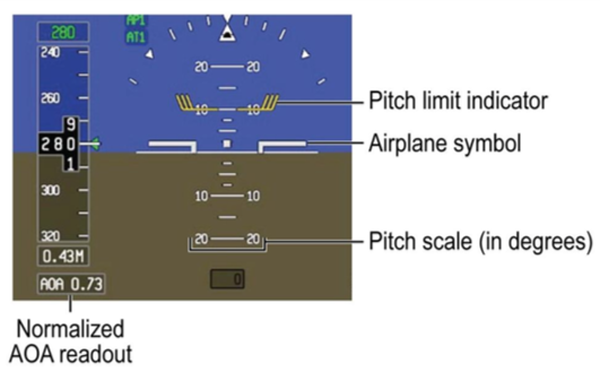
- 0.75 NAOA — A "Pitch Limit Indicator" appears on the attitude indicator, above the aircraft's flight path vector.
- 0.66 NAOA — VREF indicated on the airspeed indicator
- 0.66 NAOA and lower — approach speed indicated on the airspeed indicator
You should find out when similar cues happen for any aircraft you fly.
Approach speeds
Your aircraft manufacturer should have recommendations on what approach speed to fly, often recommending a speed additive above VREF as a margin of safety. I think you should always apply these additives when you can. Why: Approach Speed Additives.
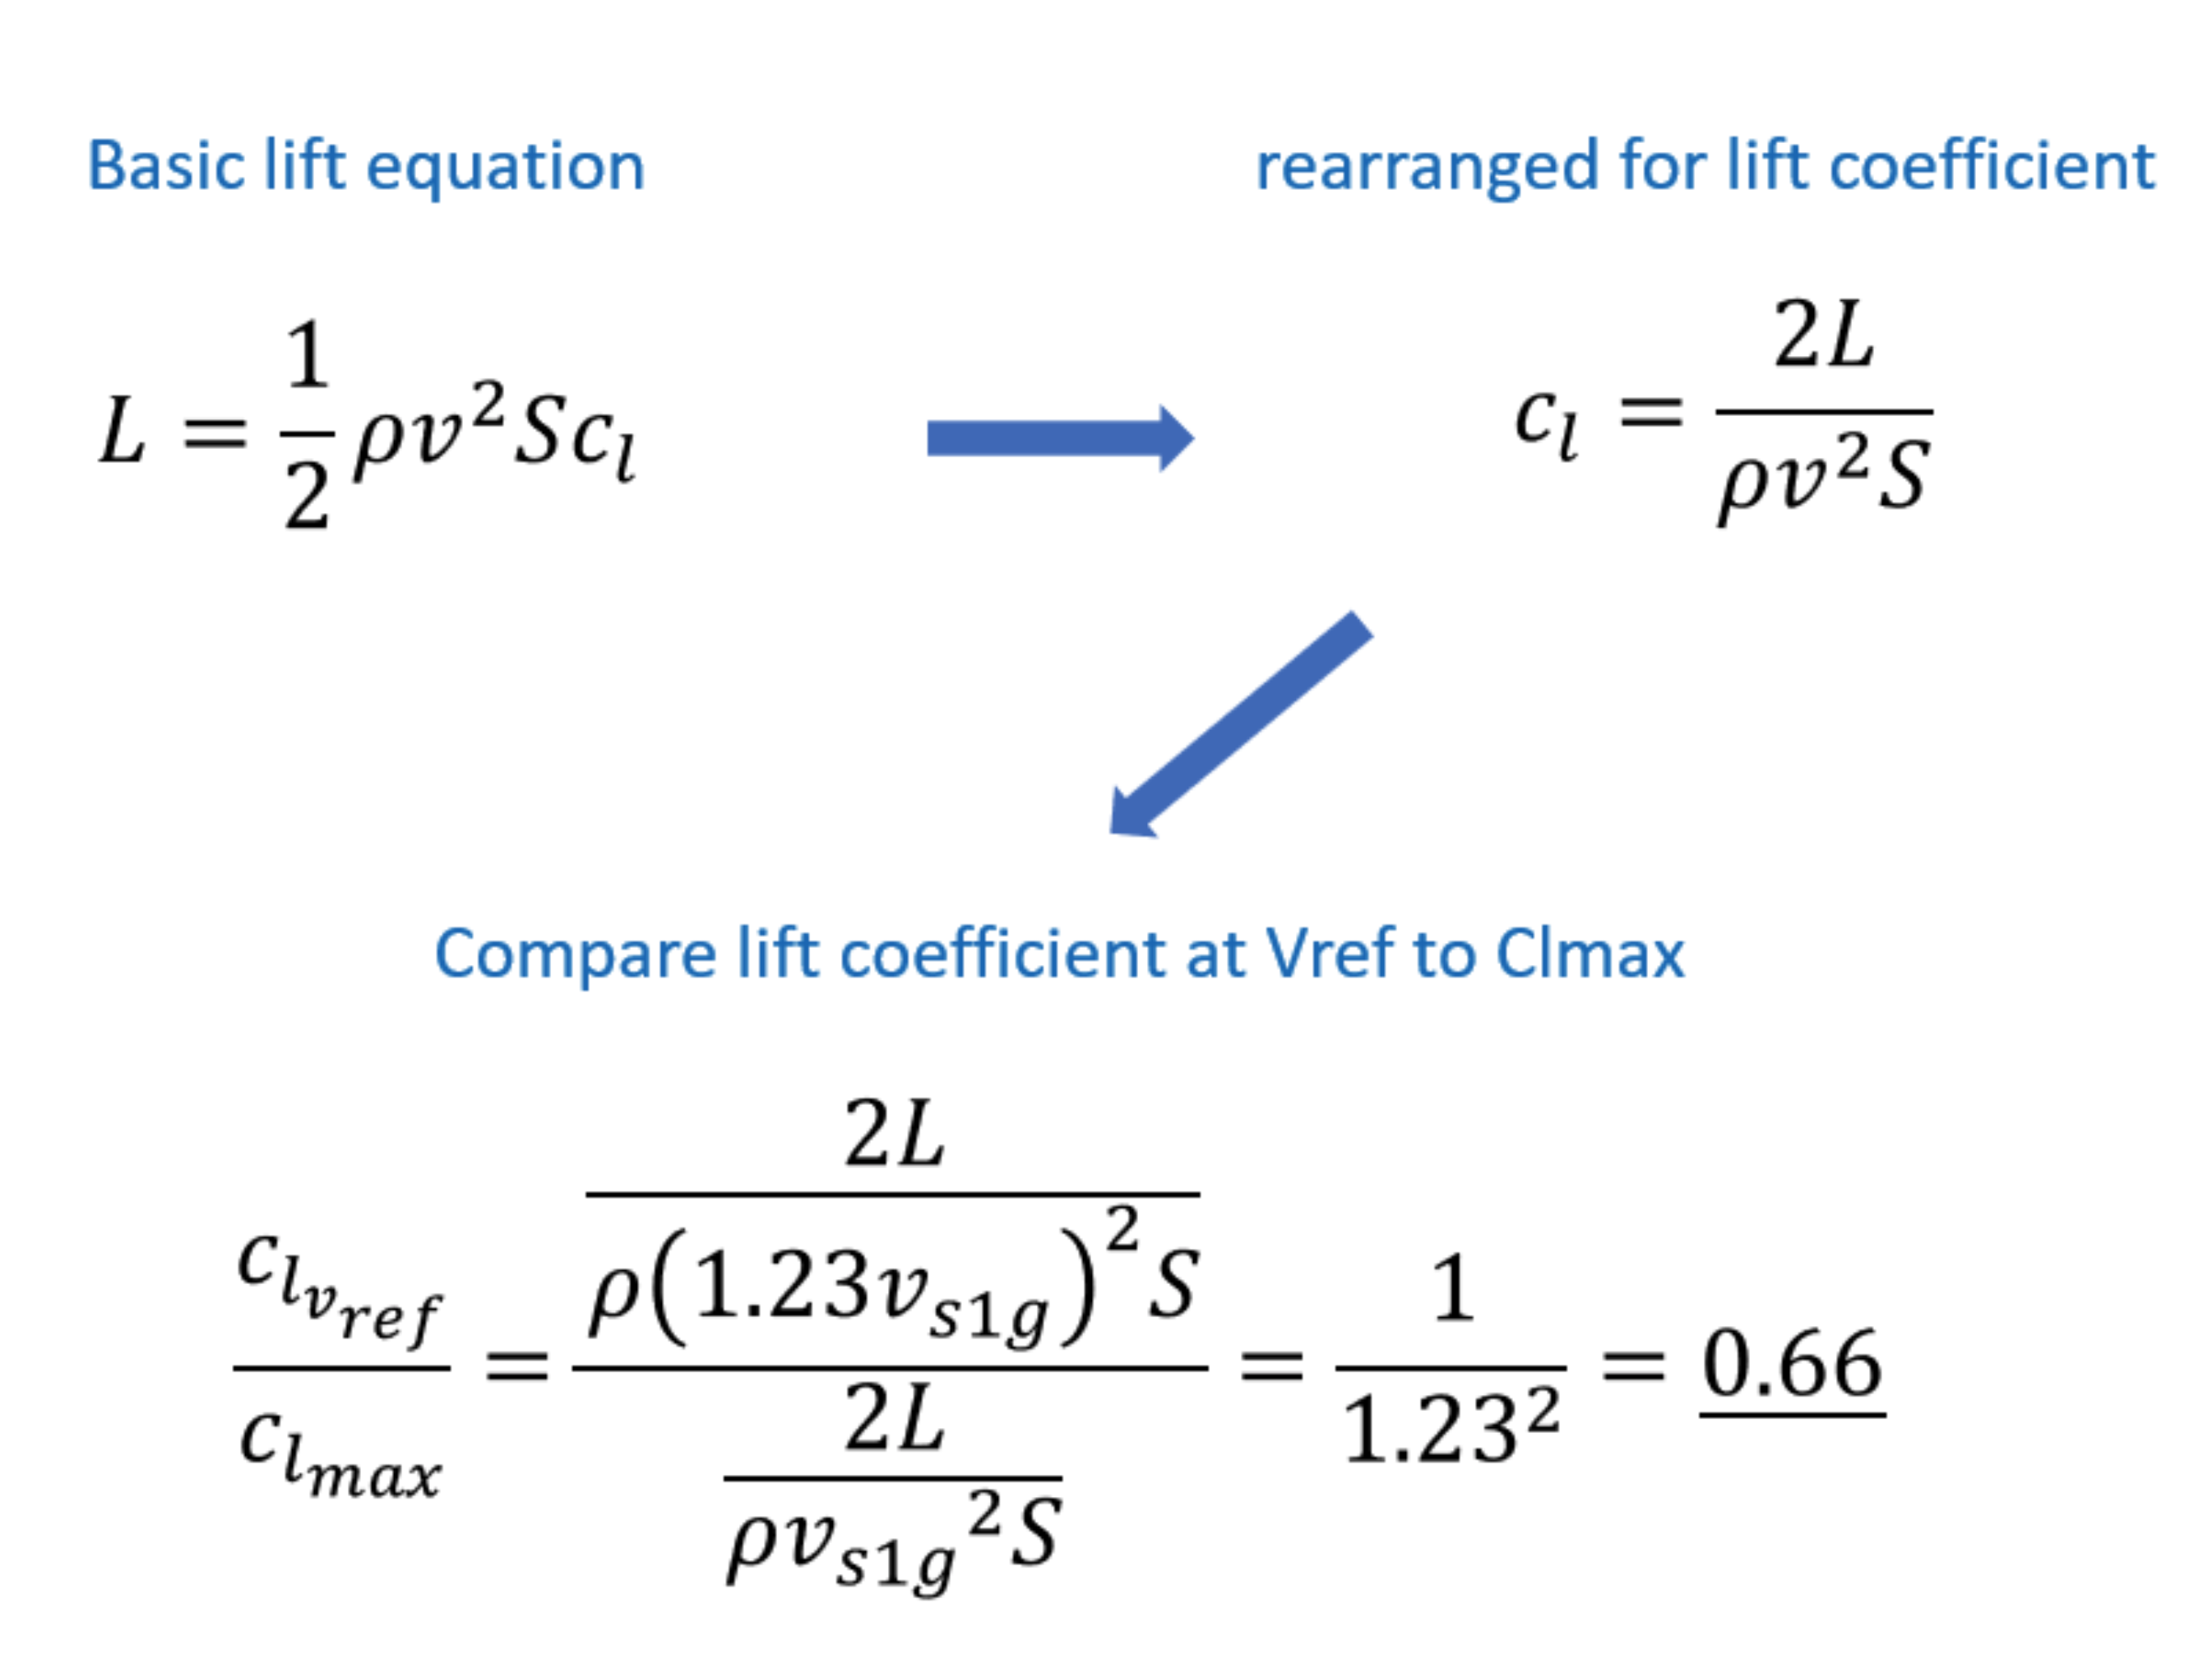
Even if you cannot (or choose not to) add to your VREF, always keep an eye on your NAOA. The magic number on approach is 0.66 NAOA. The airplane will certainly fly at a higher NAOA but you have less available NAOA for maneuvering and keeping airborne. Why 0.66 NAOA?
VREF
VREF is determined by aircraft design regulations, 14 CFR 25.135 in the case of U.S. transport category aircraft. More about this: VREF. It can also be derived mathematically, as shown by Andreas Horn at www.engineeringpilot.com
NAOA concept,
Andreas Horn (www.engineeringpilot.com)
What about for other regime's of flight? Anecdotally, I've found that 0.30 NAOA approximates long range cruise and normal "high speed cruise" happens between 0.15 to 0.25 NAOA. V2 occurs around 0.20 NAOA.
Turn performance
Dole, pg. 188
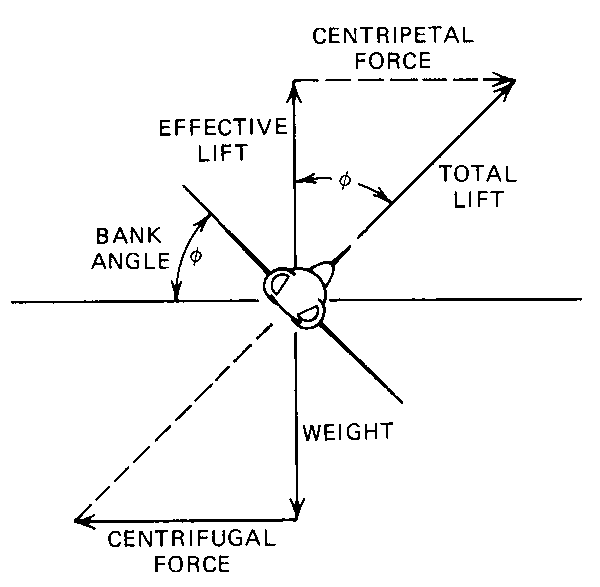
You might already know this, but some pilots don't: the wing turns the airplane not the rudder. Moreover, it is the lift generated by the wing that does the turning. So the important lesson to learn is that your wing can only generate so much lift for a given condition and that lift is divided between opposing gravity or the centrifugal force of a turn. Increasing your turn decreases the angle of attack available to keep the airplane flying. So, if you find yourself running out of lift, decrease the bank angle. More about this: Turn Performance.
References
(Source material)
14 CFR 25, Title 14: Aeronautics and Space, Federal Aviation Administration, Department of Transportation
Air Training Command Manual 51-3, Aerodynamics for Pilots, 15 November 1963
Connolly, Thomas F., Dommasch, Daniel 0., and Sheryby, Sydney S., Airplane Aerodynamics, Pitman Publishing Corporation, New York, NY, 1951.
Davies, D. P., Handling the Big Jets, Civil Aviation Authority, Kingsway, London, 1985.
Dole, Charles E., Flight Theory and Aerodynamics, 1981, John Wiley & Sons, Inc, New York, NY, 1981.
FAA-H-8083-15, Instrument Flying Handbook, U.S. Department of Transportation, Flight Standards Service, 2001.
Gulfstream G450 Airplane Flight Manual, Revision 35, April 18, 2013.
Gulfstream G450 Aircraft Operating Manual, Revision 35, April 30, 2013.
Hage, Robert E. and Perkins, Courtland D., Airplane Performance Stability and Control, John Wiley & Sons, Inc., 1949.
Hurt, H. H., Jr., Aerodynamics for Naval Aviators, Skyhorse Publishing, Inc., New York NY, 2012.
NTSB Aircraft Accident Report, AAR-12/03, Crash During Experimental Test Flight, Gulfstream Aerospace Corporation GVI (G650), N652GD, Roswell, New Mexico, April 2, 2011
Technical Order 1T-38A-1, T-38A/B Flight Manual, USAF Series, 1 July 1978.
Please note: Gulfstream Aerospace Corporation has no affiliation or connection whatsoever with this website, and Gulfstream does not review, endorse, or approve any of the content included on the site. As a result, Gulfstream is not responsible or liable for your use of any materials or information obtained from this site.